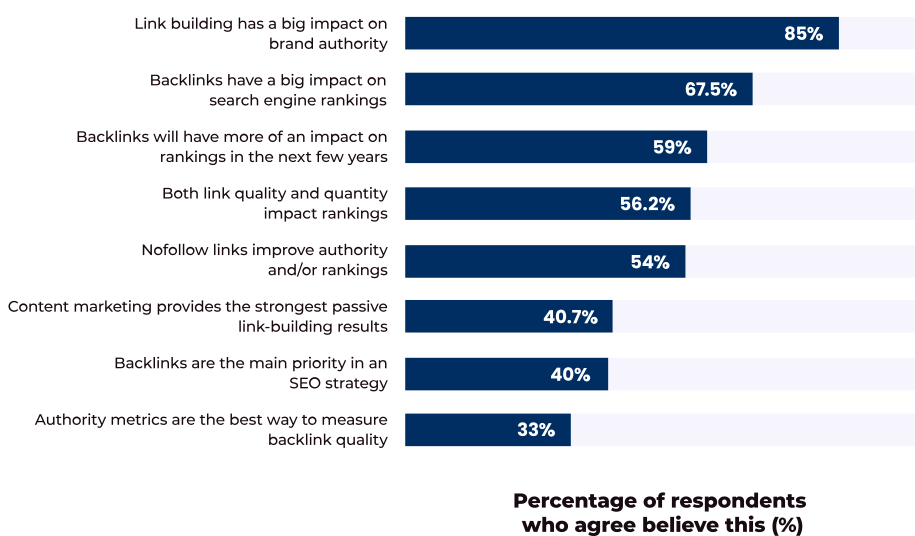
More than two-thirds (67.5%) of companies believe that link-building has a substantial impact on search engine results page (SERP) rankings (Demandsage). This isn’t surprising, given that high authority links are indeed one of the key drivers of long-term SEO growth.
However, not all forms of link building are considered equal, and digital PR is considered to be an especially effective link-building strategy that SEOs can leverage to help them earn backlinks from the highest authority publications online at a meaningful scale.
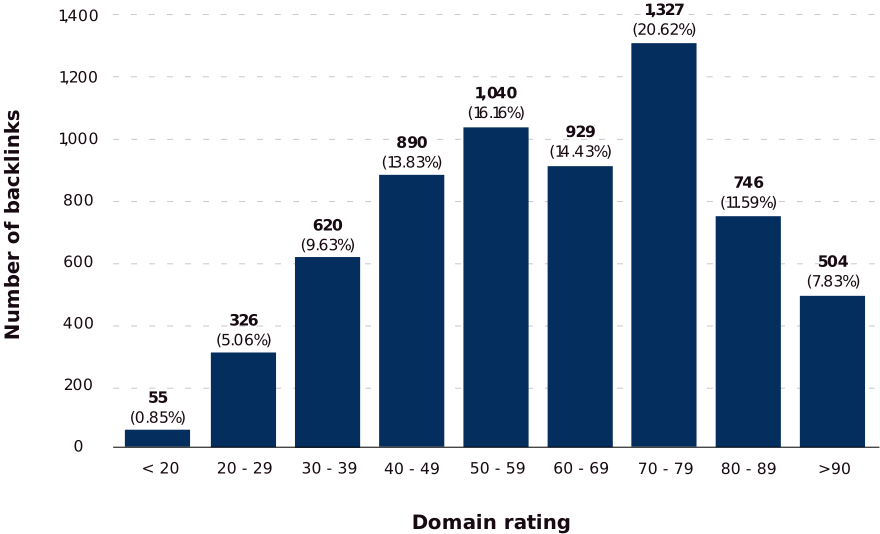
In fact, our analysis of proprietary digital PR backlink data revealed that more than a fifth (20.62%) of backlinks acquired via digital PR sit between Ahrefs Domain Rating 70 and 79.
NUMBER OF BACKLINKS ACQUIRED ACROSS DIFFERENT DOMAIN RATING (DR) BANDS IN 2024
SOURCE: REBOOT ONLINE VIA AHREFS
With this in mind, and as a leading digital PR agency, our team has compiled the latest digital PR statistics for 2026. This gives an overview of the current landscape and what the future might hold for those working in the digital PR industry, including:
Most popular types of digital PR campaigns and best-performing ones from 2024
Average digital PR salary statistics
Average cost of digital PR, and more
Top 10 must-know digital PR statistics 2026
1.
The average Ahrefs Domain Rating (DR) of a piece of digital PR coverage is around 61.
2.
The average Ahrefs URL Rating (UR) of a piece of digital PR coverage is ~11.
3.
Just under half (48.5%) of digital PR news articles analysed across selected English-speaking countries were found to contain positive sentiment analysis.
4.
Almost half (48%) of backlinks analysed from 2024 generated a follow link, compared to around a third (33%) for syndicated ones.
5.
Digital PR subject lines with questions had a 13% lower open rate than those that didn’t.
6.
Subject lines containing buzzwords had a 12% higher open rate, on average, than those that didn’t.
7.
1 In 5 (20%) industry specialists cited digital PR as their most successful link-building strategy.
8.
The UK’s most popular online news outlet in 2024 was the BBC website, used by almost three-fifths (59%) of people to access news.
9.
Approximately 4 in 5 (83%) digital PR professionals turn to media databases to find the right journalist to pitch to.
10.
Just over half (54%) of digital PR employees send follow-up emails between 3-6 days after their initial outreach.
Digital PR campaign statistics
Most popular types of digital PR campaigns
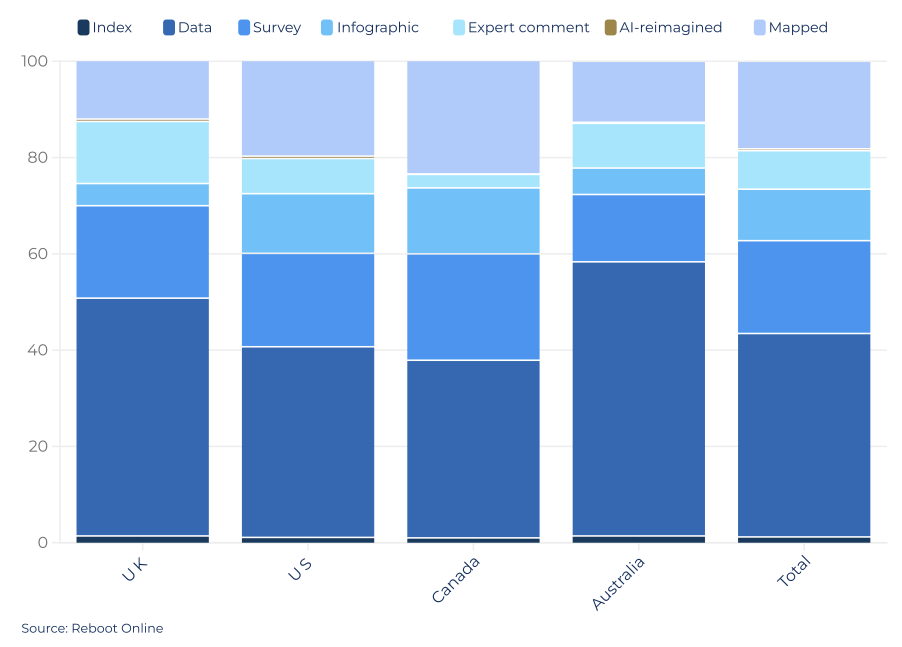
According to an analysis of digital PR statistics by search marketing agency Reboot Online, our most common digital PR campaigns between 2023-24 were mainly data-driven. These accounted for more than two-fifths (42.3%) of the campaigns analysed during this period.
The largest percentage of digital PR campaigns centred around data was found in Australia, where almost three-fifths (57%) fell into this category.
More than two-fifths (42.3%) of digital PR campaigns in 2023-24 by Reboot Online were data-driven.
FIGURE 1: MOST POPULAR DIGITAL PR CAMPAIGNS ACROSS SELECTED ENGLISH-SPEAKING COUNTRIES
NOTE: FIGURES ABOVE ARE REPRESENTED AS PERCENTAGES FIGURES ABOVE ARE REPRESENTED AS PERCENTAGES
Those involving surveys and mapping accounted for less than a fifth of digital PR campaigns analysed between 2023-24 (19.3% and 18.2%, respectively).
TABLE 1: MOST POPULAR DIGITAL PR CAMPAIGNS ACROSS SELECTED ENGLISH-SPEAKING COUNTRIES
Region
Index
Data
Survey
Info-graphic
Expert comment
AI-reimagined
Mapped
UK
1.4%
49.4%
19.2%
4.5%
12.9%
0.5%
12.0%
US
1.1%
39.6%
12.4%
7.3%
0.5%
0.5%
19.7%
Canada
1.0%
36.9%
22.1%
13.7
2.8%
0.1%
23.4%
Australia
1.4%
57.0%
14.0%
5.5%
9.3%
0.2%
12.7%
Total
1.2%
42.3%
19.3%
10.7%
8.0%
0.4%
18.2%
SOURCE: REBOOT ONLINE
Incidentally, AI-reimagined digital PR campaigns were the least common of all campaign types during this time, contributing an average of 0.4% across selected English-speaking countries.
In a study of more than 1,000 subject lines, Reboot Online found that the open rate for digital PR emails to journalists was:
Around 13% lower for subject lines phrased as questions compared to those without
Just 1% higher for those with keywords such as ‘data’, ‘study’, or ‘survey’ than those without.
Only 1% higher for listicle subject lines compared to non-listicle ones.
Approximately 12% higher for those containing buzzwords such as celebrity names, events, and special dates compared to those not containing such words.
Highest on average for those containing 4 to 8 words (with the sweet spot being somewhere between 4 and 11).
Open rates for digital PR emails to journalists were 13% lower for those phrased as questions compared to those that were not.
This suggests that journalists are more likely to open emails with clear, straightforward subject lines that contain buzzwords and are 11 or fewer words in length.
“As a species, we are naturally inquisitive and seek to explain the world around us. Therefore, email subject lines containing questions should pique this innate curiosity and entice us to find answers. This should help increase engagement with the reader, especially if it’s a question/subject/content relevant to their needs or interests, and boost the chance of them opening your email.”
HELENA MANIGLIA
HEAD OF DIGITAL PR, REBOOT ONLINE
Digital PR backlink statistics
In an analysis of 11.8 million Google search results, Backlinko found that:
A website’s overall link authority correlates to a higher ranking on the first page of Google.
Average Domain Rating (DR) increases by SERP position.
A website’s overall authority had a stronger correlation to rankings than the authority of the page itself (i.e., the URL rating).
More than 9 in 10 (95%) of all pages on Google have zero backlinks.
Those rankings first in the SERP have around 3.8 times more backlinks than those in positions 2-10.
This is supported by research from Semrush, which found that more than half (55.1%) of websites analysed without at least 1 backlink did not break into the top 10 search results. They also found that more than 9 in 10 (92.3%) of the 100 top-ranking domains have at least 1 backlink.
More than 9 in 10 (95%)pages on google have zero backlinks.
Ahrefs’s Content Explorer tool discovers around 10 million new web pages every 24 hours.
In a study of 14 billion pages, Ahrefs found that a remarkable 95.55% get no traffic at all from Google, and just 0.07% (around 9.8 million pages) get more than 1,000 visits.
They also highlighted:
A clear correlation between the number of websites linking to a page and its traffic. For example, those with an average of 1 referring domain (RD) were typically getting less than 1,000 visitors a month. By the time your page has a median RD of four, the estimated monthly search traffic rises to 1,000-1,500.
A clear correlation between the number of websites linking to a page and its traffic. For example, those with an average of 1 referring domain (RD) were typically getting less than 1,000 visitors a month. By the time your page has a median RD of four, the estimated monthly search traffic rises to 1,000-1,500.
The same trend is apparent for the number of top 100 keyword rankings. Those with 1 or 2 RDs can expect fewer than 1,000 keyword rankings in the top 100 compared to 6,000-6,500 for those with around 100 RDs.
By the time a web page gains 130 RDs, the estimated number of top 100 keyword rankings is typically between 9,500 and 10,000.
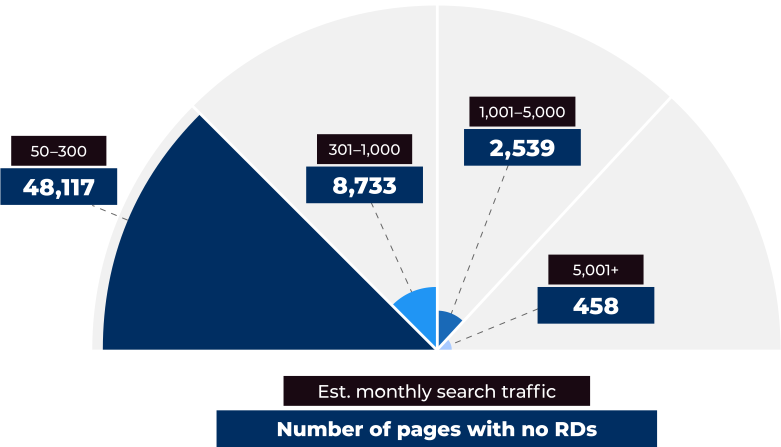
FIGURE 2: ESTIMATED MONTHLY SEARCH TRAFFIC FOR WEB PAGES WITH NO BACKLINKS
SOURCE: REBOOT ONLINE VIA AHREFS
Generally speaking, as the estimated monthly search traffic increases, the number of pages with no Referral Domains (RDs) decreases.
Analysis by Ahrefs shows that there are around 48,117 web pages with no RDs that have an average of 50-300 searches per month. This figure is around 5.5 times smaller for those with an estimated monthly search traffic of 301-1,000.
By the time a site receives more than 5,000 monthly searches, the number of pages with no RDs drops to around 458 (around 0.8% of the total).
FIGURE 3: NUMBER OF BACKLINKS ACQUIRED ACROSS DIFFERENT DOMAIN RATING (DR) BANDS IN 2024
SOURCE: REBOOT ONLINE VIA AHREFS
According to our analysis of internal backlink data, the average Ahrefs Domain Rating (DR) of a piece of digital PR coverage in 2024 was 61. This average authority is incredibly high compared to other forms of link building, and explains why so many brands are investing into modern digital PR services going into 2026.
We also found that:
More than a fifth (20.62%) of backlinks acquired throughout the year had a DR between 70-79, making it the most common group from our results.
This was followed by around a sixth (16.16%) in the mid-range of DR 50-59.
Around 1 in 13 (7.83%) backlinks have a DR of 90 or above. This represented around a quarter (27.8%) more than those with a DR of less than 30.
“Gaining backlinks from sites with a higher domain rating (DR) is beneficial for many reasons. These sites are usually more authoritative, making your campaign/content more likely to gain links from other reputable sites. This, in turn, creates a stronger backlink profile, which should have a positive impact from an SEO perspective – bolstering your search engine rankings and increasing your visibility for new and existing users.”
JAMES OLLIVER
ACCOUNT DIRECTOR, REBOOT ONLINE
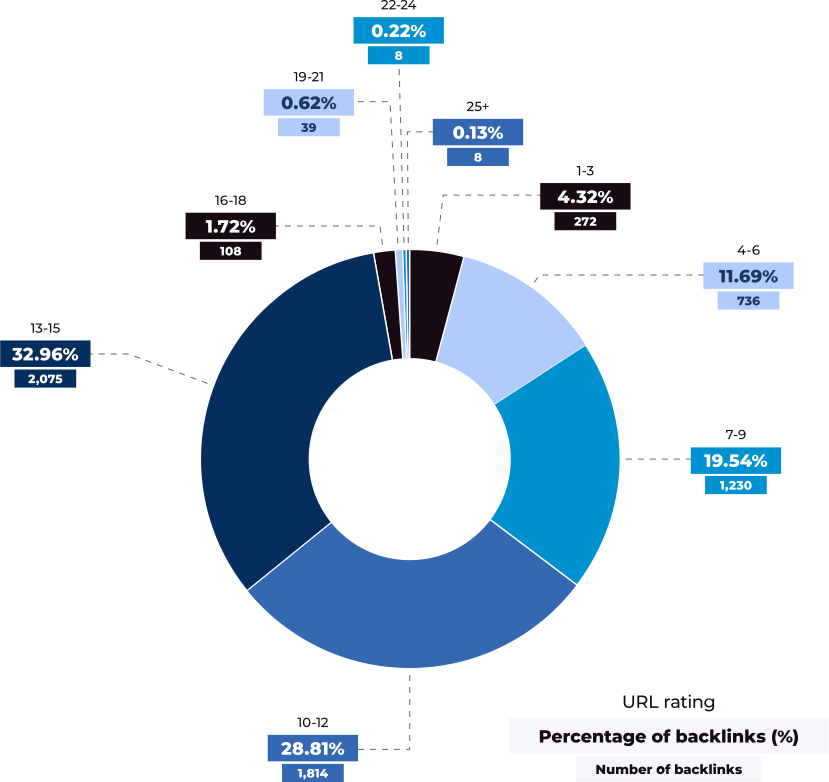
FIGURE 4: NUMBER OF BACKLINKS ACQUIRED ACROSS DIFFERENT URL RATING (UR) BANDS IN 2024
SOURCE: REBOOT ONLINE VIA AHREFS
Further analysis of digital PR backlink statistics reveals that the average Ahrefs URL Rating (UR) of a piece of digital PR coverage in 2024 was around 11.
Almost a third (32.96%) of our digital PR backlinks acquired during this time had a URL rating between 13-15, followed by more than a quarter (28.81%) for those rated 10-12.
Get in touch to see how we can help elevate your brand recognition, awareness, and outreach potential through the power of data.
According to the latest content marketing statistics, businesses make link building a priority, with nearly all (95%) companies surveyed in 2024 admitting it forms part of their content marketing strategy.
This is supported by research from uSERP that found more than 4 in 5 (85%) people working in digital PR believe that link-building has a big impact on brand authority.
FIGURE 5: DIFFERENT OPINIONS TOWARDS LINK-BUILDING IN DIGITAL PR
SOURCE: USERP
This was followed by:
More than two-thirds (67.5%) felt that backlinks have a big impact on search engine rankings.
Almost three-fifths (59%) believed that backlinks will have more of an impact on rankings in the future.
Just 1 in 3 (33%) claimed authority metrics were the best way to measure backlink quality, with 2 in 5 (40%) seeing backlinks as a main priority for their SEO strategy.
Want to take this one step further? Check out our hyper-relevancy link-building strategy and see how data-led, comprehensive content can help secure links to high-authority sites and grow organic links over time to bolster your SEO efforts.
Check out our Hyper-Relevancy Playbook for a step-by-step guide on how we plan, build, and launch a Hyper-Relevancy Project, and how you can replicate the approach yourself.
Most common link-building tactics
TABLE 1: MOST COMMON LINK-BUILDING TACTICS
Link-building tactic
Percentage of respondents (%)
Digital PR
16%
Content marketing
13%
Guest posting
12%
Link insertions
10%
Link exchanges
10%
Unclaimed mentions
10%
Directory link building
9.5%
Other
19.5%
SOURCE: USERP
Digital PR is the most common link-building tactic used within the industry, with almost 1 in 6 (16%) specialists claiming this is their primary method of acquiring links.
This was followed closely by content marketing (13%) and guest posting (12%) as popular approaches to gaining links from journalists and target publications.
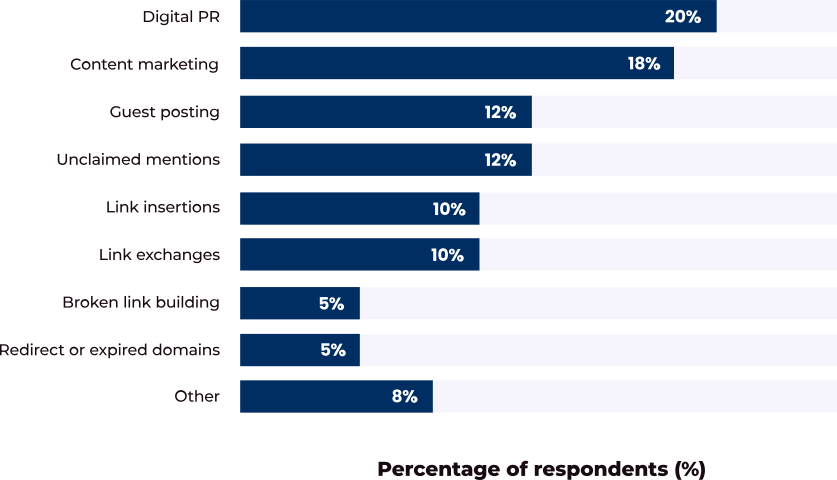
FIGURE 6: WHICH LINK-BUILDING TACTICS PROVIDE THE BEST RESULTS?
SOURCE: USERP
Around 1 in 5 (20%) industry specialists cited digital PR as their most successful link-building strategy, followed very closely by content marketing (18%).
Approximately 1 in 8 (12%) felt that guest posting or unclaimed mentions yielded the best results when it came to acquiring links, followed by 1 in 10 (10%) who believed link insertions or link exchanges were the best approach to link building.
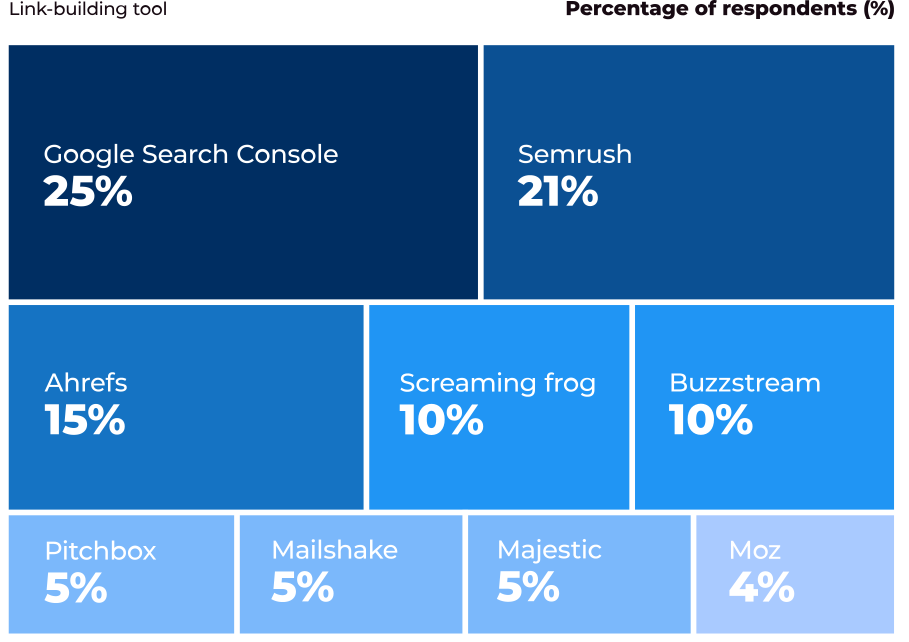
FIGURE 7: MOST POPULAR TOOLS FOR LINK BUILDING IN DIGITAL PR
SOURCE: USERP
According to a survey by uSERP, the most popular tool used by digital PR professionals and those working within a digital PR agency is Google Search Console - with around a quarter (25%) of those in the industry using it. The frequent use of this SEO reporting and analysis tool is a clear sign that digital PR experts are actively looking towards the impact that the links they're earning are driving across client sites.
This is followed by just over a fifth (21%) who mainly use Semrush and just under a sixth (15%) who predominantly use Ahrefs.
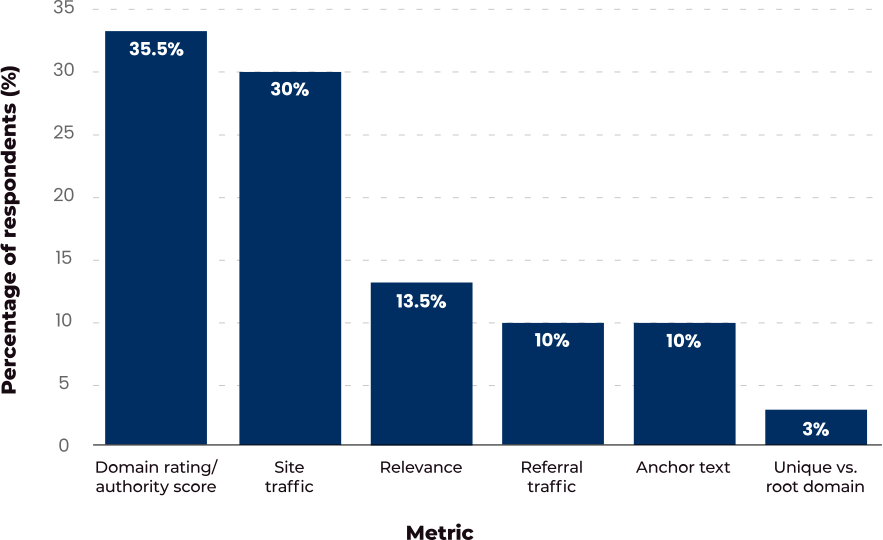
FIGURE 8: MOST POPULAR METRIC USED TO MEASURE THE QUALITY OF BACKLINKS IN DIGITAL PR
SOURCE: USERP
The main metric used by those working in digital PR to measure the quality of backlinks is the domain rating (DR) or domain authority (DA) of the site in question.
In all, more than a third (33.5%) of digital PR specialists rate this as their most popular metric, followed by just under a third (30%) who gravitate towards site traffic as the primary measure for backlink quality.
Less than 1 in 7 (13.5%) claim to use relevance to determine the quality of backlinks in digital PR.
TABLE 3: MAIN KPIS WHEN DETERMINING THE SUCCESS OF LINK-BUILDING STRATEGIES IN DIGITAL PR
KPI
Percentage of respondents (%)
Digital PR
16%
Traffic increase
22.5%
Ranking increase
19%
Referral traffic
13%
Sales conversions
13%
New unique domains
12%
Total links
10.5%
DR increase
10%
SOURCE: USERP
The most popular KPI used in digital PR to determine a successful link-building strategy is the extent to which traffic has increased.
According to a survey by uSERP, just over a fifth (22.5%) of digital PR specialists use this as their primary KPI for success metric when it comes to link-building, followed by just under 1 in 5 (19%) who opt for an increase in rankings.
An equal percentage (13%) feel that the amount of referral traffic or sales is the most important KPI when it comes to judging the success of a link-building campaign in digital PR.
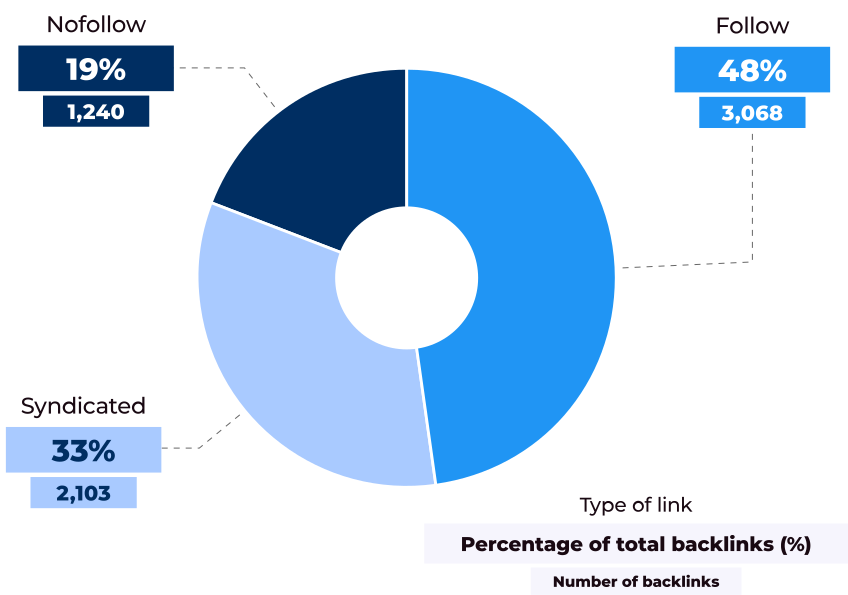
Digital PR statistics reveal that almost half (48%) of backlinks analysed from 2024 generated a follow link, compared to around a third (33%) for syndicated ones.
FIGURE 9: NUMBER OF DIGITAL PR BACKLINKS BY LINK TYPE
SOURCE: REBOOT ONLINE VIA AHREFS
By contrast, just under 1 in 5 (19%) backlinks gained throughout the year acquired a nofollow link.
Digital PR backlinks statistics by topic/theme
Based on an analysis of more than 6,200 acquired backlinks from digital PR campaigns in 2024, more than a sixth (17.09%) represented the news/media industry, making it the most popular category for digital PR backlinks in our study.
TABLE 4: NUMBER OF DIGITAL PR BACKLINKS BY CATEGORY
Category
Number of backlinks
Percentage of total backlinks (%)
News/media industry
674
17.09%
News/newspapers
524
13.29%
Regional/Europe
268
6.80%
Computers/internet/on the web
261
6.62%
Reference/education
149
3.78%
Recreation/Travel
147
3.73%
Society/people
125
3.17%
Business/arts and entertainment
118
2.99%
Business
105
2.66%
Business/construction and maintenance
88
2.23%
World/Deutsch
80
2.03%
News/magazines and e-zines
66
1.67%
Health/dentistry
57
1.45%
Society
56
1.42%
News
56
1.42%
SOURCE: REBOOT ONLINE VIA AHREFS
This was followed by almost 1 in 7 (13.29%) backlinks from news/newspapers, making it around twice as popular as those obtained from the regional/European category.
Read more on how we have achieved this with different clients across varying niches:
How are news publications sharing digital PR campaigns?
Most popular online media outlets for digital PR
It’s estimated that the average American spends around 8 hours per day digesting digital media. This is perhaps unsurprising given that analysis by digital PR agency Reboot Online found online news to be the main source of information for almost three-quarters (72%) of Americans when it came to news stories and current affairs.
This trend is apparent in other parts of the world too, notably the UK, when the internet replaced TV as the most popular news source for the first time in 2024 (71% vs. 70%, respectively).
FIGURE 10: TOP MEDIA OUTLETS FOR ONLINE NEWS IN THE US AND UK (2024)
SOURCE: WEBFX
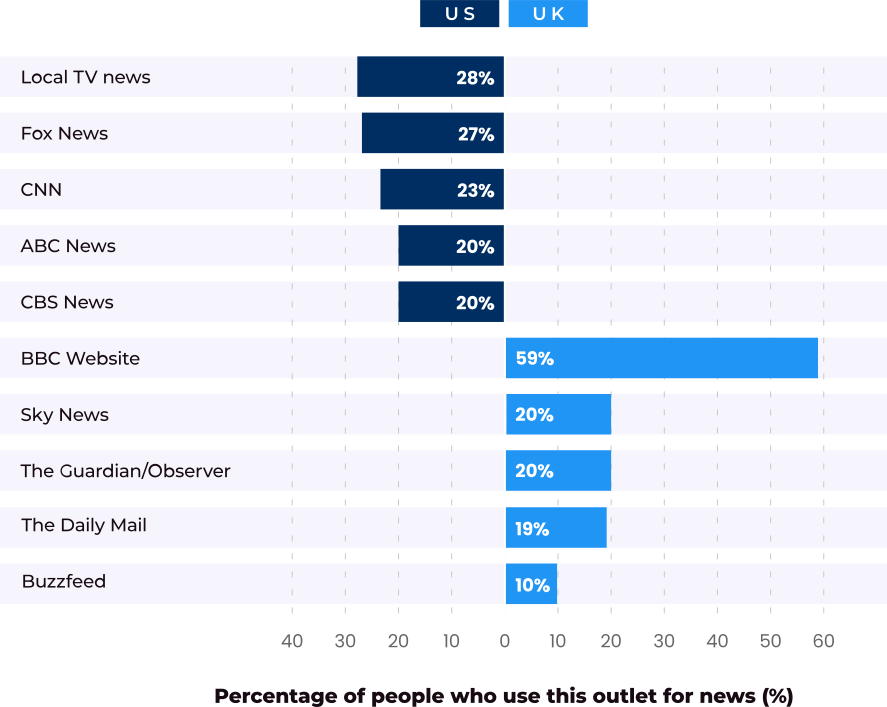
The BBC website was the most popular news outlet in the UK in 2024, used by almost three-fifths (59%) of people to access news updates.
The UK's most popular online news outlet in 2024 was the BBC website, used by almost three-fifths (59%) of people throughout the year to access news.
Around a fifth (20%) of people either went to Sky News or The Guardian/Observer as their primary source of online news, followed closely by The Daily Mail (19%).
Conversely, in the US, the split between online news outlets was much more even in 2024. Local TV news was the most popular source for just over a quarter (28%) of people, followed by Fox News (27%).
Learn how you can get more leads and enquiries with a local SEO company by ranking at the top of the organic search results in your niche.
FIGURE 11: TOP SOCIAL MEDIA, MESSAGING, AND VIDEO NETWORKS FOR NEWS IN THE US AND UK (2024)
SOURCE: REUTERS INSTITUTE, UNIVERSITY OF OXFORD, AND OFCOM
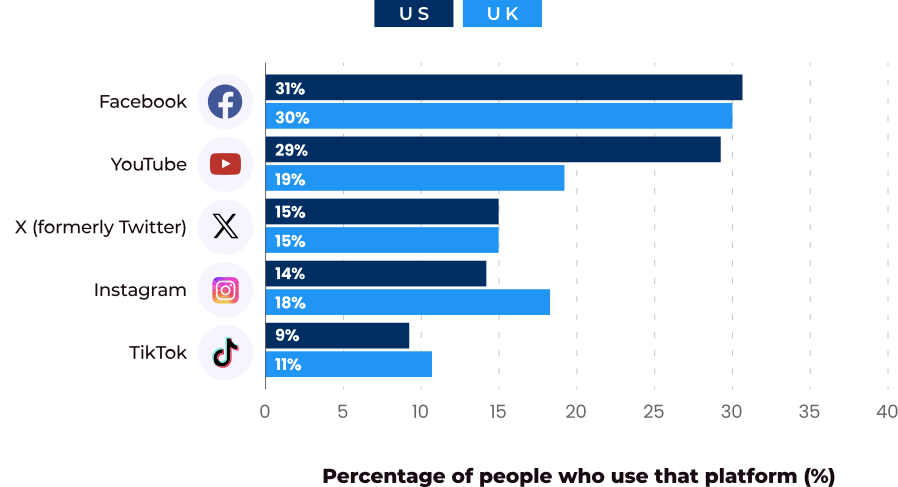
As of 2024, Facebook was the most popular social media platform for news in the UK and the US, with just under a third of adults from each country using it to access news updates regularly (30% and 31%, respectively).
This is contrasted by just under 1 in 3 (29%) adults in the US who use YouTube to access the news, compared to less than 1 in 5 19%) UK adults.
In 2020, around 1% of adults in the UK used TikTok to obtain news information – a figure that rose to 11% in 2024 (the largest increase across all social media platforms during this time). This is compared to less than 1 in 10 (9%) US adults who turn to TikTok when it comes to watching the news via social media.
Most common digital PR news articles by sector
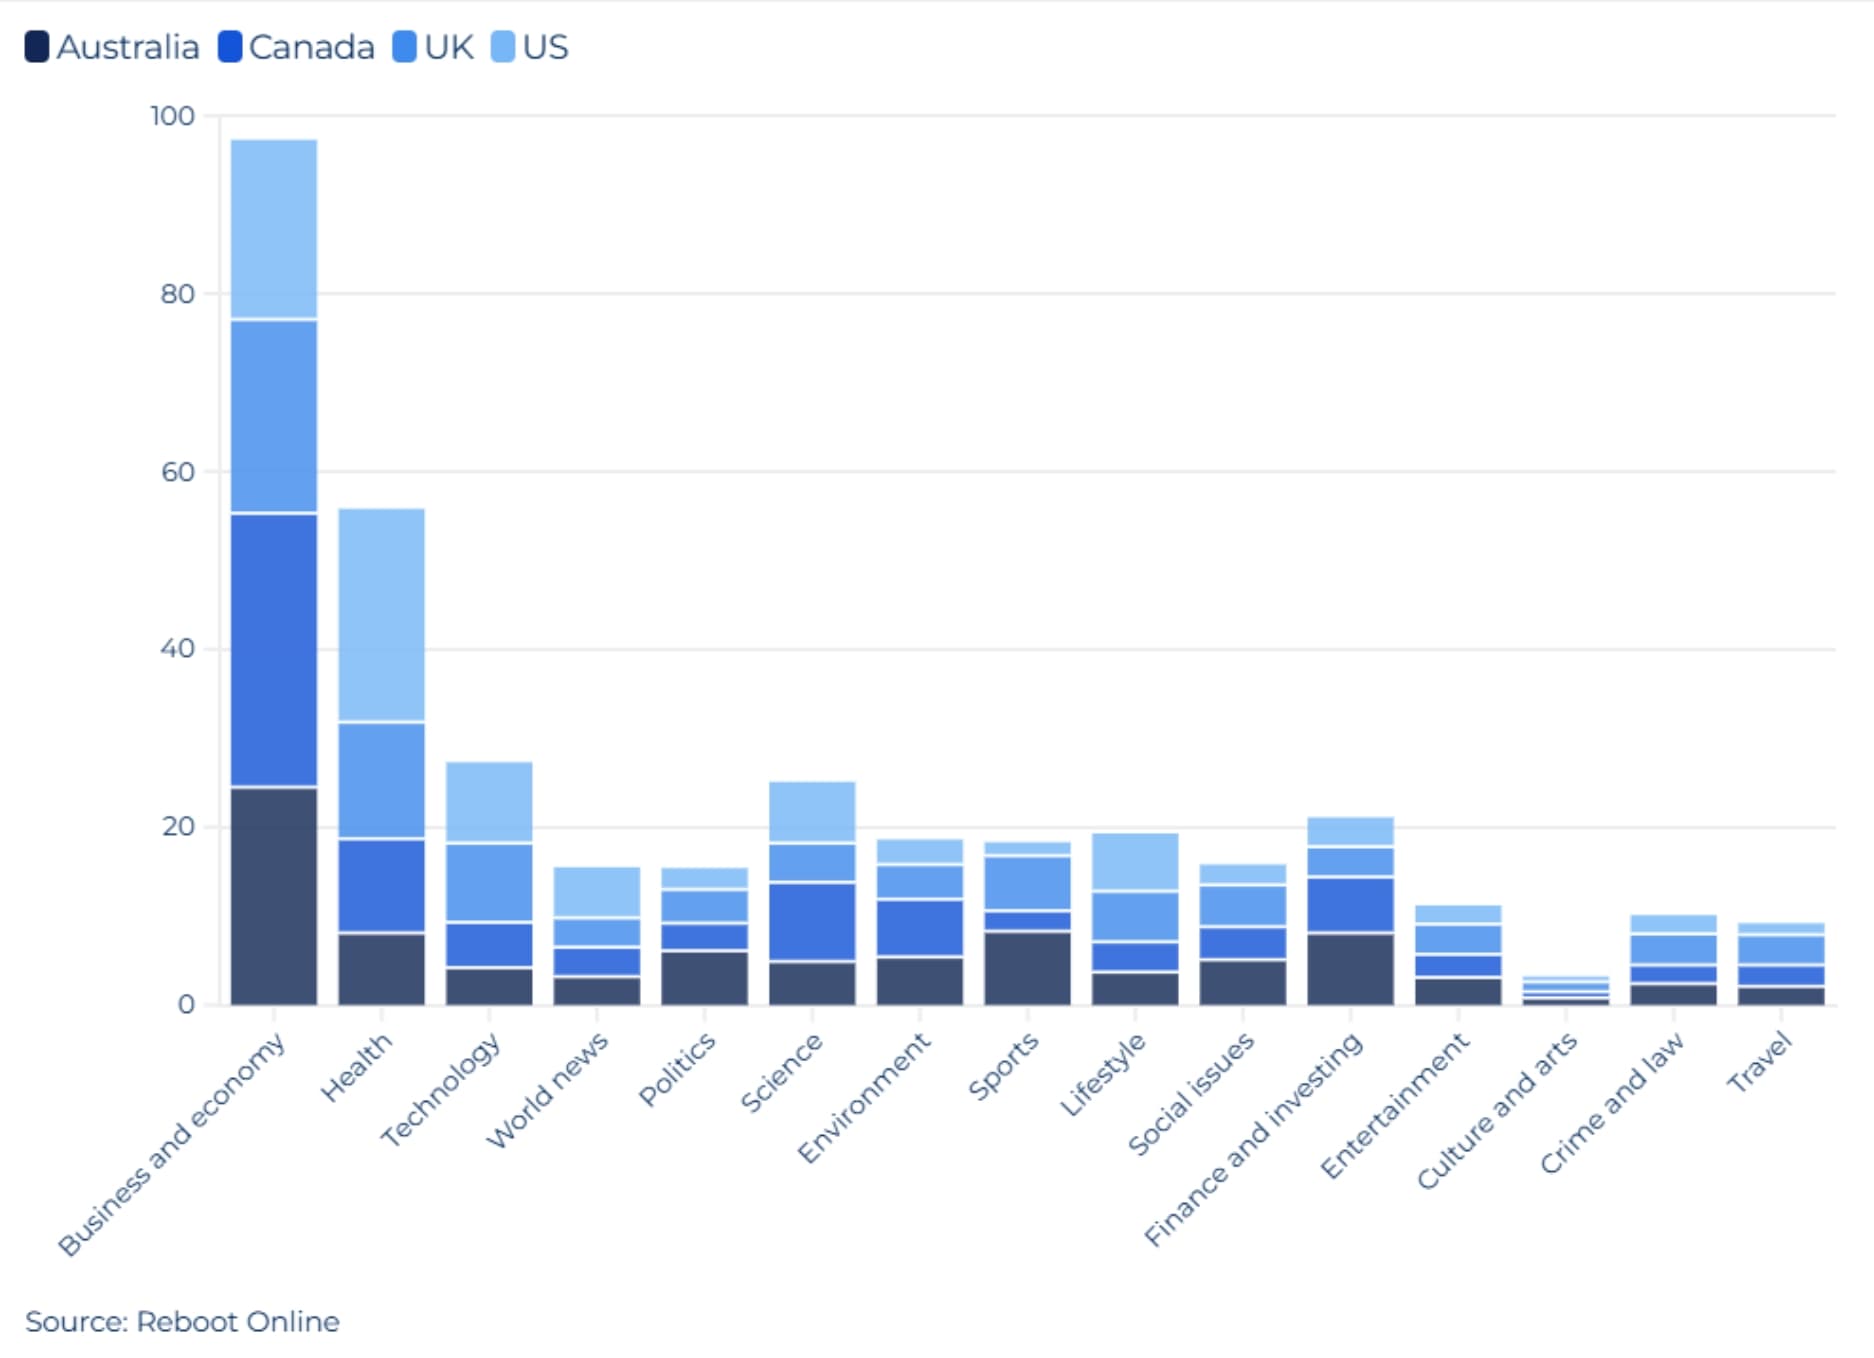
According to an analysis by digital PR company Reboot Online of more than 370,000 news articles, the most common industry to be represented in digital PR news across 2024 was business and the economy. This accounted for around 1 in 5 (22.2%) articles across selected English-speaking countries.
This was followed by those from the health sector (13.6%) and technology (6.5%), and mirrors the general pattern shown in UK-based articles.
Business and the economy were the most popular industries from digital PR news articles in 2023-24, accounting for more than 1 in 5 (22%).
FIGURE 12: MOST COMMON DIGITAL PR NEWS ARTICLES BY INDUSTRY ACROSS SELECTED ENGLISH-SPEAKING COUNTRIES
SOURCE: REBOOT ONLINE
NOTE: FIGURES ABOVE ARE REPRESENTED AS PERCENTAGES
This trend was reversed in the US, with around a quarter (24%) of analysed news articles covering health-related topics, followed by around a fifth (20.2%) for business and the economy.
TABLE 5: MOST COMMON DIGITAL PR NEWS ARTICLES BY INDUSTRY ACROSS SELECTED ENGLISH-SPEAKING COUNTRIES
Industry
Australia
Canada
UK
US
Total result
Business and economy
24.5%
30.8%
21.8%
20.2%
22.2%
Health
8.1%
10.6%
13.1%
24.0%
13.6%
Technology
4.2%
5.1%
8.9%
9.1%
6.6%
World news
3.2%
3.3%
3.3%
5.7%
6.5%
Politics
6.1%
3.1%
3.8%
2.4%
6.3%
Science
4.9%
8.9%
4.4%
6.9%
6.3%
Environment
5.4%
6.5%
3.9%
2.8%
5.4%
Sports
8.3%
2.3%
6.2%
1.5%
4.1%
Lifestyle
3.7%
3.4%
5.7%
6.5%
3.8%
Social issues
5.1%
3.7%
4.7%
2.3%
3.7%
Finance and investing
8.1%
6.3%
3.4%
3.3%
3.7%
Entertainment
3.1%
2.6%
3.4%
2.1%
2.8%
Culture and arts
0.8%
0.7%
1.1%
0.6%
2.3%
Crime and law
2.4%
2.1%
3.5%
2.1%
2.2%
Travel
2.1%
2.4%
3.4%
1.3%
2.1%
SOURCE: REBOOT ONLINE
The largest proportion of articles relating to business and the economy was in Canada, with around a third (30.8%) falling under this category, followed by approximately 1 in 10 (10.6%) for health.
One of the appeals of digital PR is its versatility and how it applies to various sectors, niches, and fields. For more details, check out some examples of the various digital PR industries we work with and how we could help grow your business.
TABLE 6: MOST POPULAR DIGITAL PR NEWS ARTICLES BY CLASSIFICATION AND INDUSTRY
Industry
AI-reimagined (%)
Data ($)
Expert comment
Index study (%)
Infographics (%)
Mapped (%)
Survey study (%)
Business and economy
24.0%
24.23%
14.80%
57.12%
24.76%
14.09%
21.53%
Politics
0.41%
3.49%
2.20%
5.00%
4.71%
2.72%
20.19%
Health
8.87%
21.90%
16.53%
4.77%
15.90%
5.14%
11.56%
Social issues
0.13%
6.72%
0.86%
5.92%
1.45%
1.37%
7.73%
World news
0.50%
6.94%
3.34%
5.22%
12.79%
5.88%
4.60%
Technology
28.91%
4.17%
4.60%
2.39%
8.69%
8.43%
4.23%
Entertainment
4.94%
0.99%
3.67%
0.12%
2.42%
3.89%
3.72%
Lifestyle
0.10%
0.78%
15.12%
0.18%
1.74%
0.86%
3.56%
Environment
0.47%
5.93%
4.38%
3.21%
2.82%
12.48%
3.07%
Sports
7.21%
1.88%
9.66%
0.20%
3.43%
3.85%
2.84%
Travel
0.10%
1.87%
4.25%
1.09%
1.08%
1.26%
2.76%
Finance and investing
4.28%
3.21%
7.86%
4.17%
4.16%
0.50%
2.72%
Education
0.23%
2.25%
0.95%
1.26%
2.44%
2.07%
2.09%
Crime and law
0.16%
4.34%
1.20%
0.38%
2.25%
2.52%
1.50%
Science
16.97%
3.73%
1.39%
1.00%
2.57%
22.06%
1.31%
Local news
0.02%
0.83%
0.31%
0.22%
1.22%
2.33%
1.10%
National news
0.00%
1.19%
0.06%
0.71%
0.19%
0.35%
0.91%
Culture and arts
1.83%
0.41%
2.23%
0.08%
4.31%
4.66%
0.89%
Automotive
0.05%
0.94%
1.07%
1.25%
0.42%
0.61%
0.81%
Human interest stories
0.15%
0.36%
0.69%
0.13%
0.52%
1.29%
0.78%
Real estate
0.07%
1.65%
0.83%
5.04%
0.55%
0.50%
0.58%
Food and drink
0.15%
0.36%
1.64%
0.13%
0.36%
0.51%
0.51%
Public safety
0.00%
0.55%
0.07%
0.01%
0.11%
0.34%
0.32%
Religion and spirituality
0.07%
0.06%
0.04%
0.00%
0.09%
0.05%
0.24%
Opinion and editorials
0.15%
0.07%
0.26%
0.00%
0.19%
0.26%
0.19%
Parenting and family
0.02%
0.20%
1.06%
0.00%
0.02%
0.05%
0.15%
Weather
0.06%
0.86%
0.33%
0.17%
0.55%
0.58%
0.05%
History
0.02%
0.06%
0.06%
0.04%
0.23%
1.22%
0.04%
Fashion and style
0.07%
0.03%
0.55%
0.17%
0.02%
0.13%
0.02%
SOURCE: REBOOT ONLINE
Reboot’s analysis of digital PR statistics found that the most common classification for campaigns in 2024 was an index study, accounting for almost three-fifths (57.12%) of business and economy-related news articles across the year.
This sector was also responsible for around a quarter (24.76%) of infographics and data studies (24.23%) across all industries, as well as more than a fifth of surveys (21.53%).
The analysis also found that:
AI-reimagined pieces are a growing trend, but as of 2024, they tend to feature more in the technology sector (28.91% of articles).
Mapped studies are most common in the science sector, at around 1 in 5 (22.06%) articles.
Expert comments are the least favoured classification of digital PR campaigns, with health and lifestyle being the areas they are most likely to appear in (16.53% and 15.12%, respectively).
Sentiment analysis of news articles
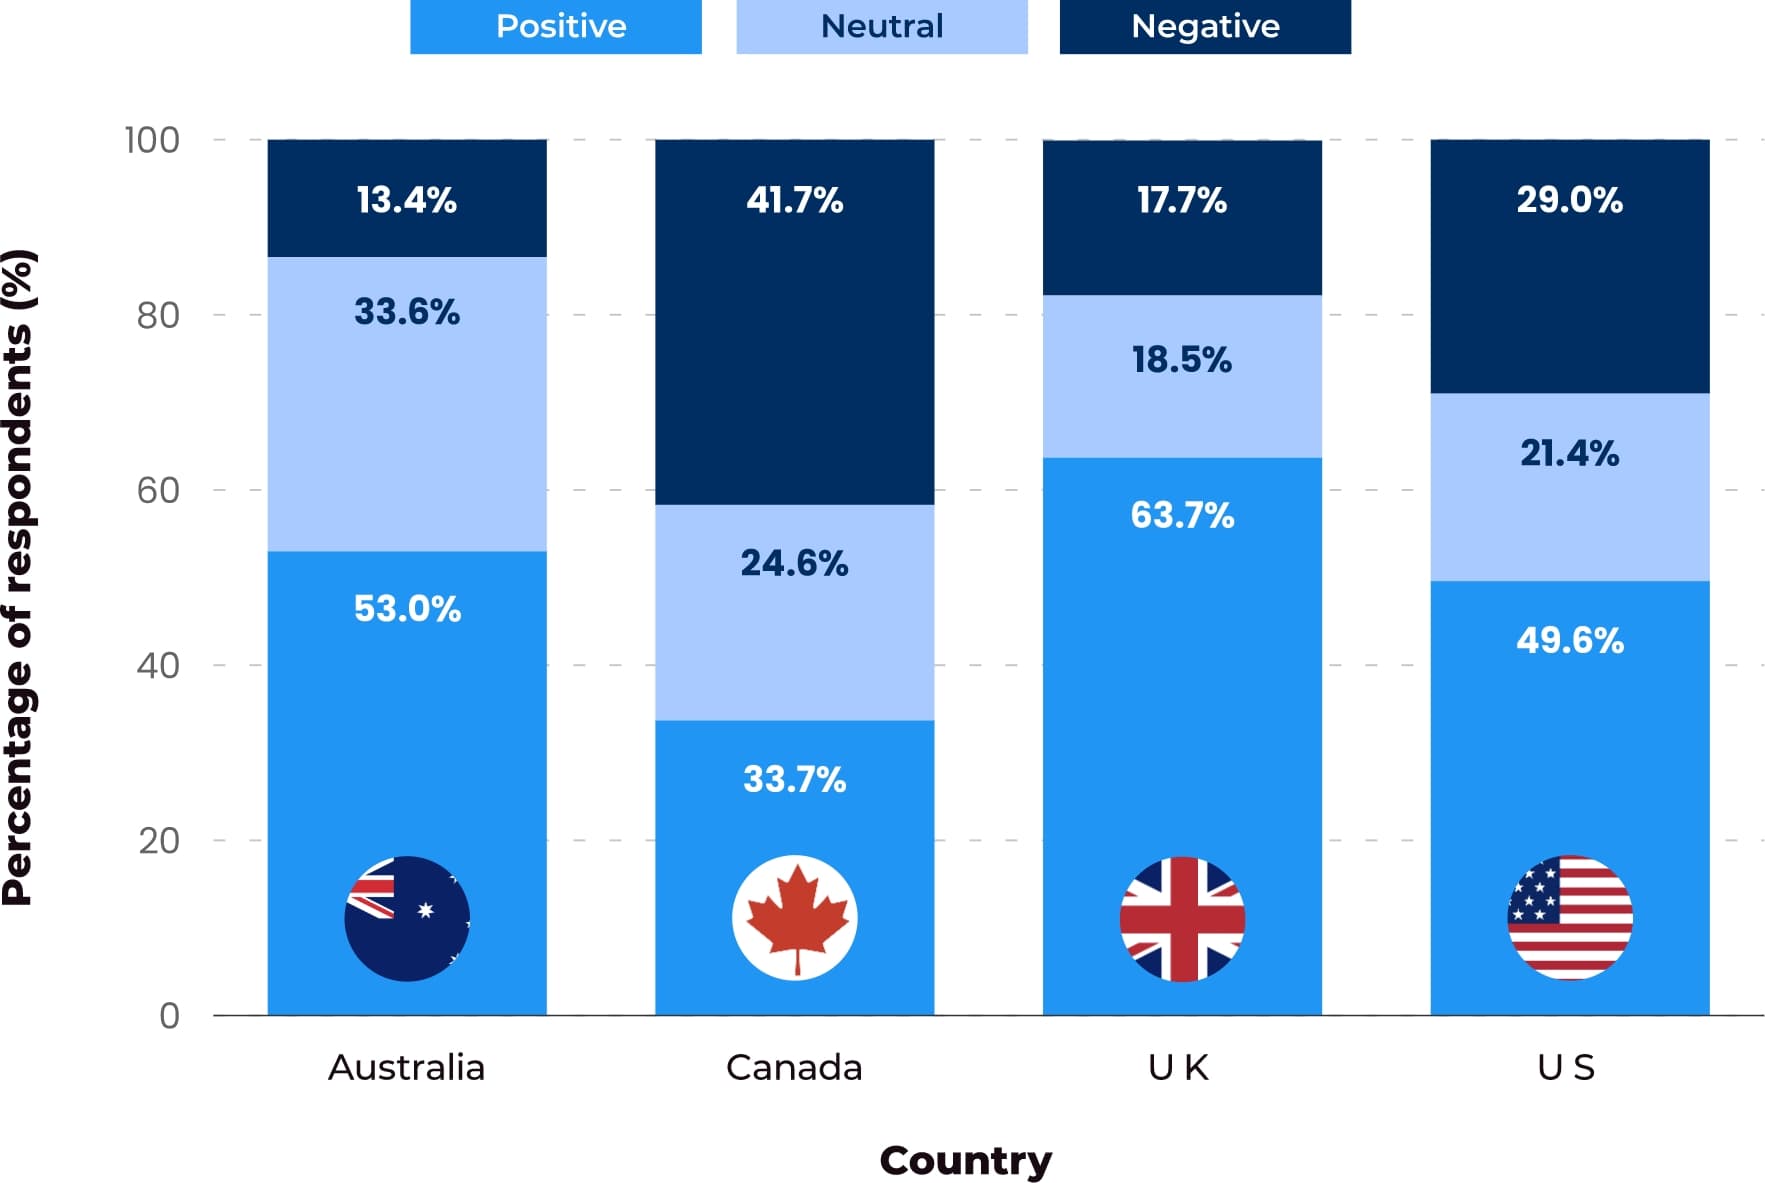
Just under half (48.5%) of the digital PR news articles analysed by Reboot from selected English-speaking countries were found to contain positive sentiment analysis. This figure was highest in the UK, where 51.1% of the articles assessed had positive connotations, followed by Canada at 51%.
Just under half (48.5%) of news articles analysed in 2023-24 had positive sentiments, with just over a fifth (22.4%) for negative.
FIGURE 13: SENTIMENT ANALYSIS OF DIGITAL PR NEWS ARTICLES ACROSS SELECTED ENGLISH-SPEAKING COUNTRIES
SOURCE: REBOOT ONLINE
Conversely, just over a fifth (22.4%) of digital PR campaigns displayed negative sentiment. This was proportionally higher in the US, where around a third (33.3%) of articles were deemed to be negative in nature. This was contrasted by just over a quarter (25.9%) of news pieces in neighbouring Canada.
“Digital PR campaigns are inherently linked to a company and its branding. Therefore, making a positive impression with their target audience is key to attracting new customers and retaining existing ones. Building a positive brand image should help benefit brand awareness and foster trust with people. Negative PR campaigns, while attention-grabbing, tend to be quite reactive. This could have the opposite effect and indeed damage a company’s reputation.”
BETH SURRIDGE
SENIOR DIGITAL PR MANAGER, REBOOT ONLINE
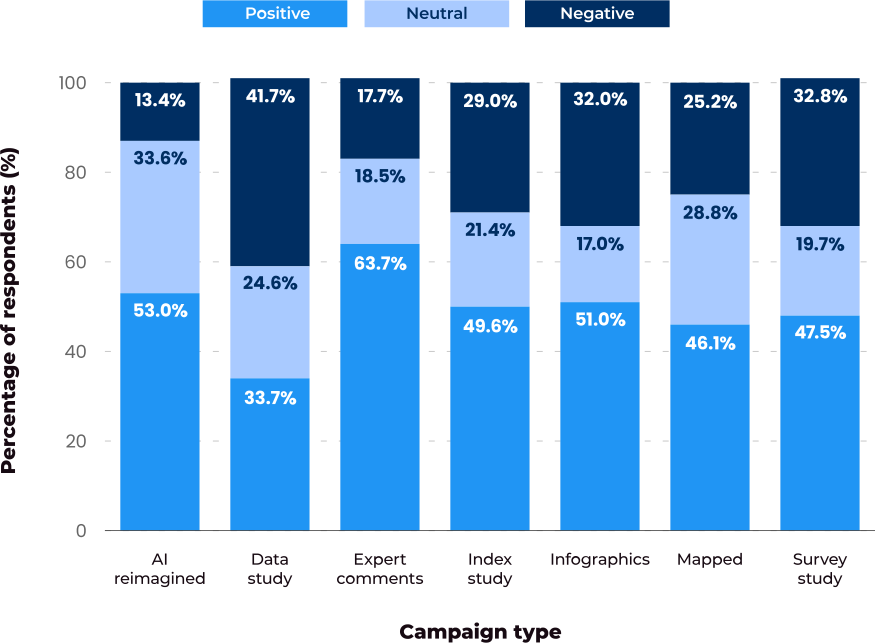
FIGURE 14: SENTIMENT ANALYSIS OF NEWS ARTICLES BY CAMPAIGN TYPE
SOURCE: REBOOT ONLINE
A study of more than 370,000 digital PR articles by Reboot Online found that those containing expert comments tend to have the largest degree of positive sentiment at just under two-thirds (63.7%). This is followed by AI-reimagined pieces and infographics, both at just over half (53% and 51%, respectively).
On the flip side, around two-fifths (41.7%) of the articles analysed displayed a negative sentiment analysis – the highest recorded percentage across all digital PR campaign types. This was followed by surveys and infographics, where almost a third (32.8% and 32%, respectively) were deemed to have a negative angle to their content.
TABLE 7: SENTIMENT ANALYSIS OF NEWS ARTICLES BY CAMPAIGN TYPE
Classification
Positive
Neutral
Negative
Automotive
63.0%
19.2%
17.8%
Business and economy
61.4%
20.0%
18.6%
Crime and law
10.0%
10.2%
79.8%
Culture and arts
62.5%
20.7%
16.9%
Education
61.0%
19.5%
19.5%
Entertainment
56.9%
20.7%
22.4%
Environment
29.5%
30.6%
40.0%
Fashion and style
85.1%
9.4%
5.4%
Finance and investing
59.4%
19.7%
20.9%
Food and drink
76.1%
14.3%
9.6%
Health
27.3%
20.8%
51.9%
History
23.8%
41.5%
34.7%
Human interest stories
52.6%
15.4%
32.0%
Lifestyle
66.9%
16.7%
16.4%
Local news
47.7%
23.6%
28.7%
National news
22.0%
30.7%
47.3%
Opinion and editorials
60.4%
13.1%
26.5%
Parenting and family
76.3%
12.6%
11.1%
Politics
45.7%
19.4%
34.9%
Public safety
18.2%
11.8%
70.0%
Real estate
46.2%
36.2%
17.7%
Religion and spirituality
35.8%
15.4%
48.8%
Science
42.1%
43.4%
14.5%
Social issues
27.5%
16.5%
56.1%
Sports
63.5%
18.1%
18.4%
Technology
63.0%
19.9%
17.1%
Travel
64.4%
22.5%
13.1%
Weather
13.2%
14.8%
72.1%
World news
19.4%
38.8%
41.8%
SOURCE: REBOOT ONLINE
In terms of sentiment analysis by sector, the overwhelming majority (85.1%) of articles analysed in the fashion and style industry had positive connotations. This was followed by parenting and family, and food and drink, where around three-quarters (76.3% and 76.1%, respectively) were positive in their content.
On the other side, the crime and law sector tends to show the largest degree of negative sentiment when it comes to digital PR campaigns. Almost 4 in 5 (79.8%) articles analysed fell into this category – almost 7% more than the next category (weather) at 72.1%.
Statistics on working in digital PR
UK digital PR job statistics
As of 2024, the most common digital PR job in the UK was a Marketing Assistant. This accounted for around 1 in 6 (16%) digital PR job adverts analysed throughout the year.
TABLE 8: MOST COMMON DIGITAL PR JOB TITLES IN THE UK
Job titles
Job count
Percentage of digital PR job adverts (%)
Marketing Assistant
56
16.0%
Marketing Executive
36
10.3%
Marketing Manager
24
6.9%
Social Media Manager
24
6.9%
Head of Marketing
20
5.7%
Marketing Coordinator
19
5.4%
Digital Marketing Executive
18
5.2%
Digital Marketing Assistant
11
3.2%
Social Media Executive
9
2.6%
Marketing Specialist
9
2.6%
SOURCE: REBOOT ONLINE VIA GLASSDOOR, INDEED, AND LINKEDIN
Of the 349 UK job postings in 2024 relating to positions in the digital PR industry, around 1 in 10 (10.3%) were for Marketing Executives, followed by 6.9% for both Marketing Manager and Social Media Manager vacancies.
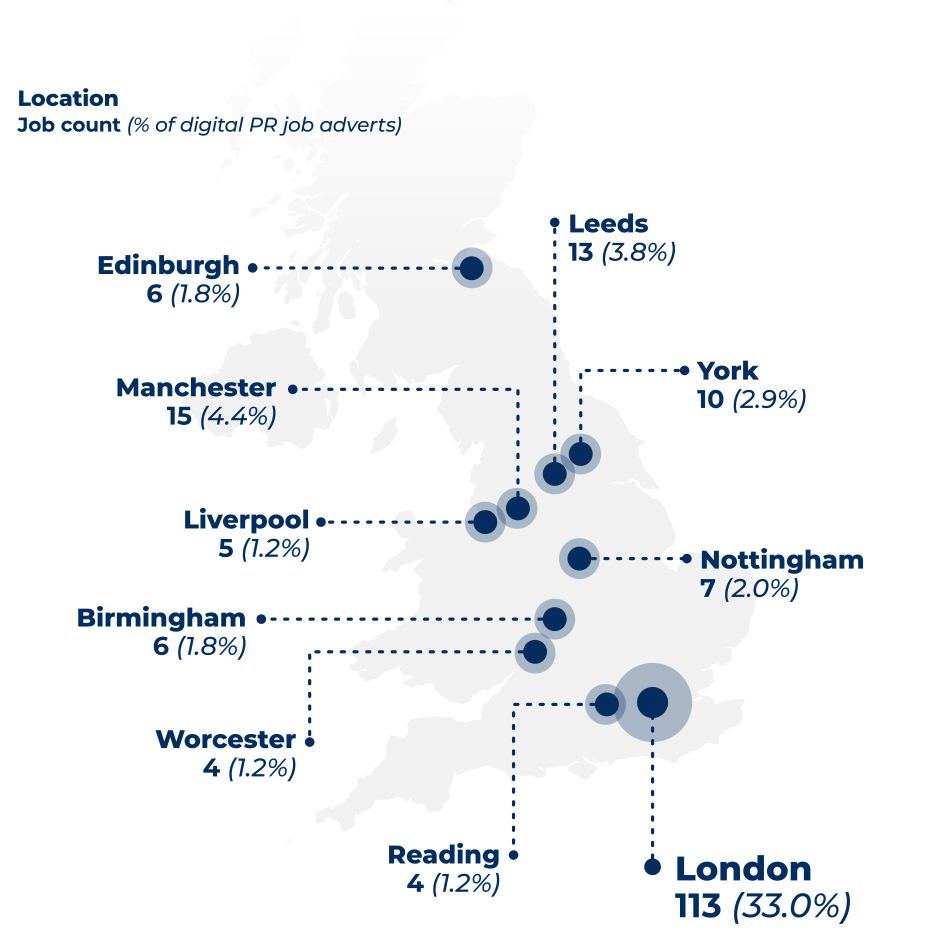
FIGURE 15: MOST COMMON LOCATIONS FOR DIGITAL PR JOBS IN THE UK
SOURCE: REBOOT ONLINE VIA GLASSDOOR, INDEED, AND LINKEDIN
A third (33%) of UK job postings in 2024 for digital PR roles were based in London, almost 8 times more common than Manchester in second place (4.4%).
In all, London had around half (48.4%) more digital PR vacancies in 2024 than the remaining 9 cities in the top 10 put together.
TABLE 9: AVERAGE SALARY FOR DIGITAL PR JOBS IN THE UK
Type of average
Average salary (£)
Mean
£37,104
Median
£31,500
SOURCE: REBOOT ONLINE VIA GLASSDOOR, INDEED, AND LINKEDIN
As of 2024, the mean average salary for someone in the UK working in digital PR was £37,104. This was around a sixth more (16.3%) compared to the median average for the same year.
For those looking to enter the industry, our paid digital PR training programme combines structured learning with work on live campaigns.
US digital PR job statistics
Between 2023-24, Social Media Manager was the most common digital PR job vacancy in the US, accounting for just under 1 in 20 (4.5%) postings throughout this period.
TABLE 10: MOST COMMON DIGITAL PR JOB TITLES IN THE US
Job titles
Job count
Percentage of digital PR job adverts (%)
Social Media Manager
34
4.5%
Marketing And Public Relations Specialist
26
3.4%
Digital Marketing Manager
25
3.3%
Social Media Marketing Intern
19
2.5%
Digital Marketing Intern
17
2.3%
Digital Marketing Specialist
16
2.1%
Senior Paid Media Manager
11
1.5%
Digital Project Manager
10
1.3%
Social Media Coordinator
9
1.2%
Public Relations Intern
7
0.9%
SOURCE: REBOOT ONLINE VIA GLASSDOOR AND INDEED
This was followed by Marketing and Public Relations Specialist (3.4%) and Digital Marketing Manager (3.3%), which cumulatively made up 6.7% of US digital PR job postings for 2023-24.
For more information, check out what life is like working for an elite digital marketing agency such as Reboot Online and how we can help your brand stand out from the crowd in the ever-changing, fast-moving world of digital marketing.
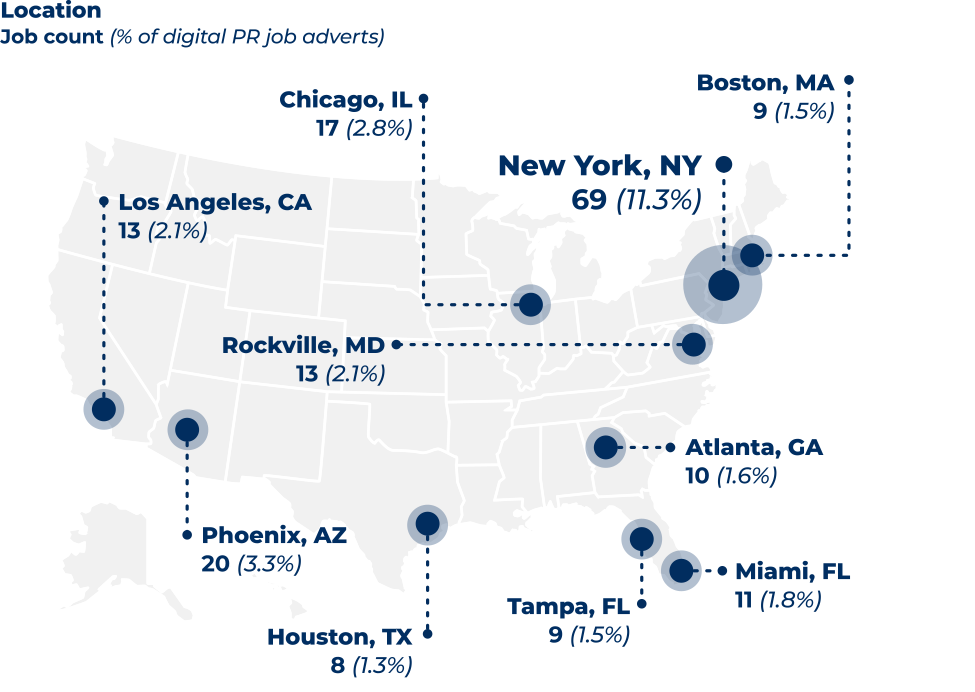
FIGURE 16: MOST COMMON LOCATIONS FOR DIGITAL PR JOBS IN THE US
SOURCE: REBOOT ONLINE VIA GLASSDOOR, INDEED AND LINKEDIN
The average earnings of someone in the US working in digital PR in 2024 was $84,942.
The majority of US digital PR-related job vacancies in 2023-24 were located in New York, accounting for around 1 in 10 (11.3%) postings for the year.
This was proceeded by Phoenix (Arizona) and Chicago (Illinois), which made up a respective 3.3% and 2.8% of US job listings for digital PR roles between 2023-24.
TABLE 11: AVERAGE SALARY FOR DIGITAL PR JOBS IN THE US
Type of average
Average salary ($)
Mean
$84,942
Median
$70,250
SOURCE: REBOOT ONLINE VIA GLASSDOOR AND INDEED
Of the 224 US digital PR job listings that mentioned salary between 2023-24, the mean average earnings was $84,942 a year.
This was almost a fifth (18.9%) more than the median average salary for someone in the US working in digital PR for the same year.
Digital PR pitch statistics
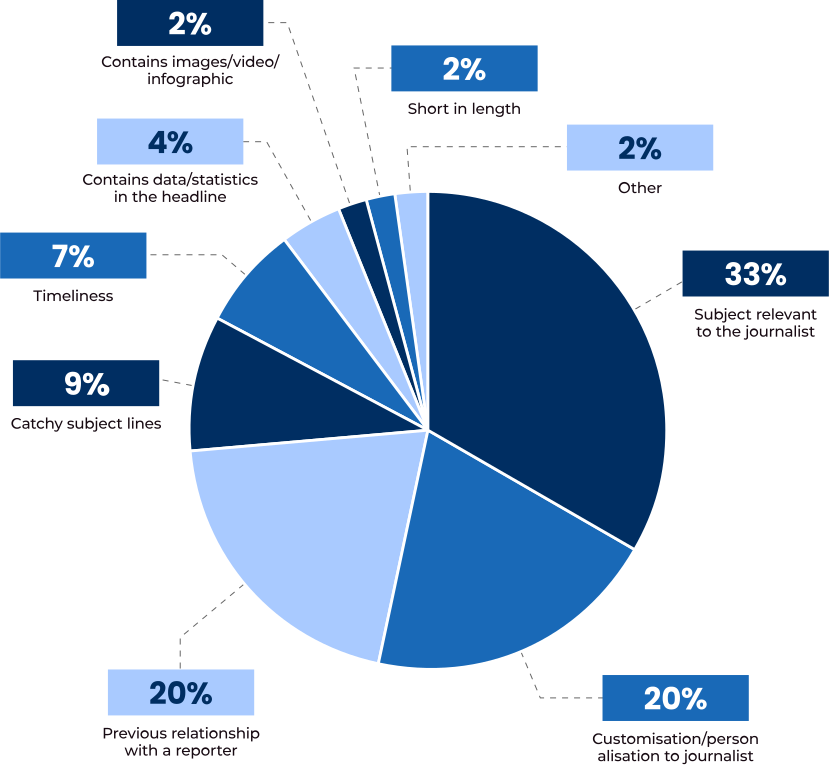
According to survey data by Superlinks, a third (33%) of those working in digital PR believe getting a subject relevant to the journalist is the most important component when it comes to securing pitch coverage in the industry.
FIGURE 17: MOST IMPORTANT COMPONENTS IN SECURING COVERAGE WITH A PITCH IN DIGITAL PR
SOURCE: SUPERLINKS
This is followed by around a fifth who feel customisation to the journalist or having a previous relationship with a reporter (both 20%) are the most important factors in getting your pieces covered in the digital PR sector.
A third (33%) of digital PR specialists believe getting a relevant subject for the journalist is the most important feature of a successful pitch.
This is becoming harder as the channel matures. BuzzStream’s 2026 State of Digital PR report found that 75% of digital PR professionals believe digital PR is more challenging this year, while 60.8% say finding relevant journalists has become more difficult in the last 12 months.
For practical advice on pitching UK journalists, including subject lines, timings and how to make a story relevant to the right publication, read our guide to digital PR in the UK.
FIGURE 18: MOST EFFECTIVE CHANNELS FOR PITCHING JOURNALISTS IN DIGITAL PR
SOURCE: SUPERLINKS
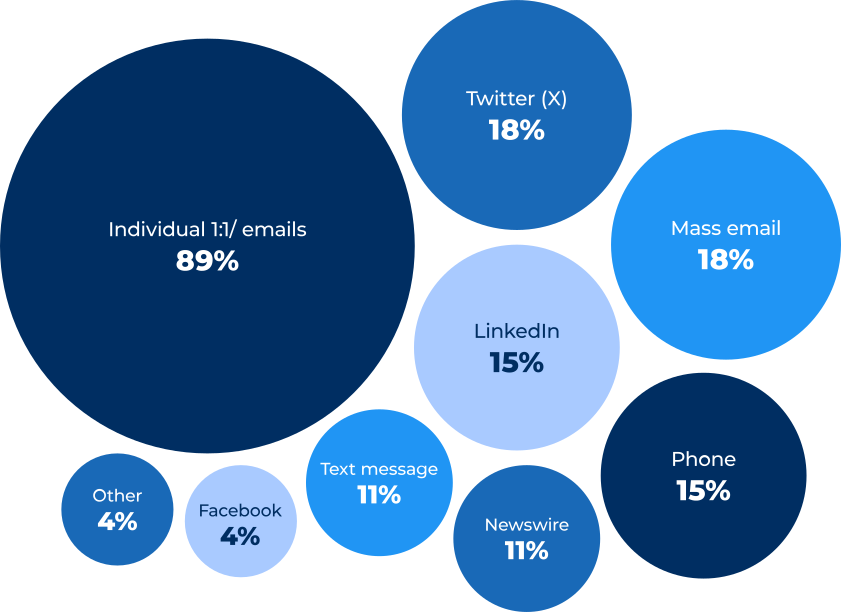
Around 9 in 10 (89%) of those working in digital PR believe that the most effective channel for pitching to journalists is on an individual 1:1 level and/or through email.
This is around 5 times more popular than sending mass emails or using Twitter (X) to communicate with reporters and get their pitches heard (both 18%).
Incidentally, almost 1 in 6 (15%) people interviewed by Superlinks believe LinkedIn or the phone provides the best channel for pitching to journalists.
FIGURE 19: MOST COMMON TYPES OF MEDIA USED FOR PITCHING IN DIGITAL PR
SOURCE: SUPERLINKS
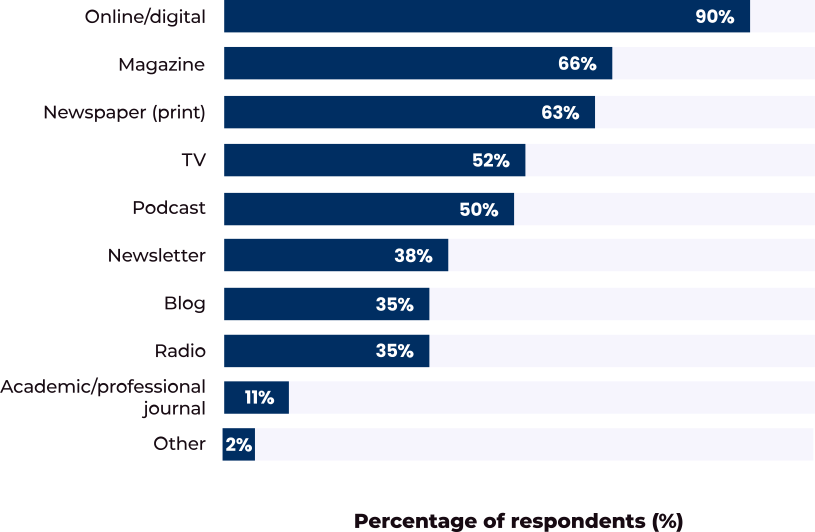
As perhaps expected, the vast majority (90%) of people working in digital PR will use online media to send out their campaign pitches to journalists.
Around two-thirds (66%) still use magazines to do so, with slightly less (63%) opting for printed newspapers and just over half (52%) utilising TV as their main method of pitching.
FIGURE 20: MOST COMMON METHODS TO FIND THE RIGHT JOURNALIST TO PITCH TO IN DIGITAL PR
SOURCE: SUPERLINKS
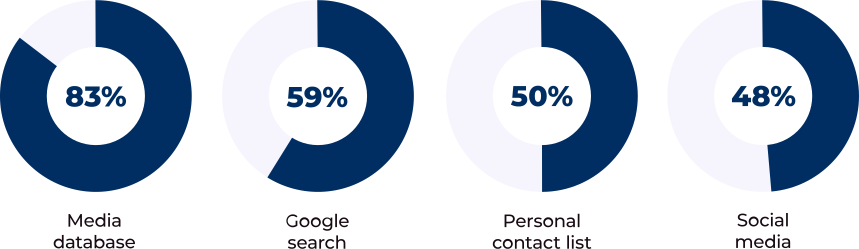
Via their digital PR survey, Superlinks found that almost 4 in 5 (83%) professionals turn to a media database to find the right journalist to pitch to.
This is contrasted by just under 3 in 5 (59%) who use Google search and around half who use either a personal contact list (50%) or social media (48%).
TABLE 12: MOST COMMON PLATFORMS USED TO STORE MEDIA LISTS IN DIGITAL PR
Platform
Percentage of respondents (%)
Spreadsheets
68%
Dedicated PR software (e.g. Muck Rack)
64%
Marketing automation software
7%
Sales CRM
6%
Not sure
4%
Other
4%
SOURCE: SUPERLINKS
In terms of the most common platforms used to store media lists in digital PR, more than two-thirds (68%) opt for spreadsheets, with slightly less (64%) choosing a dedicated PR software such as Muck Rack.
Measuring success in the digital PR industry
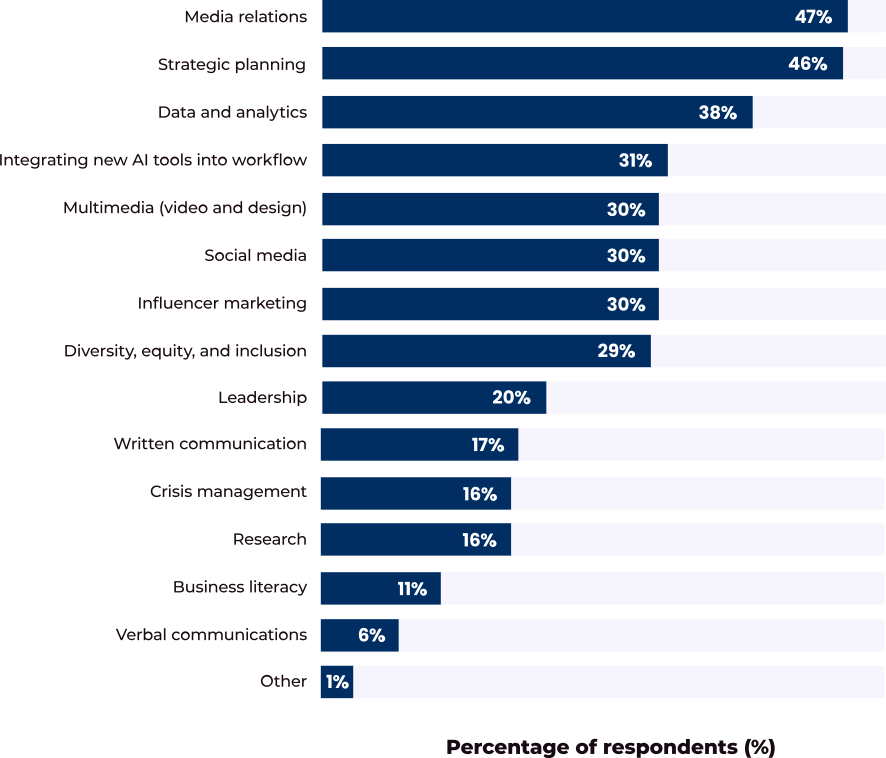
According to digital PR survey data from Superlinks, almost half of those working in the profession feel that successful digital PR companies should focus on media relations (47%) and strategic planning (46%).
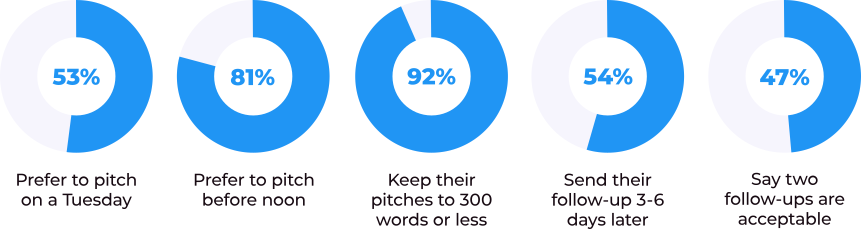
Tuesday is the most popular day to send out digital PR campaign pitches (53%), with more than four-fifths (81%) stating this should happen before noon.
FIGURE 21: MOST POPULAR SKILLS THAT COMPANIES NEED TO FOCUS ON TO BE SUCCESSFUL IN DIGITAL PR
SOURCE: SUPERLINKS
This is followed by around two-fifths (39%) who believe success is defined by a knowledge of data and analytics.
FIGURE 22: PREFERENCES OF THOSE WORKING IN THE DIGITAL PR INDUSTRY
SOURCE: SUPERLINKS
Superlink’s digital PR survey also highlights that Tuesday is the preferred day to send out campaign pitches (53%), with more than four-fifths (81%) of digital PR professionals stating this should preferably happen before noon.
The overwhelming majority (92%) of digital PR employees surveyed like to keep their pitches to 300 words or less, with just over half (54%) looking to send follow-up emails between 3 and 6 days after their initial communication with a journalist.
Biggest challenges faced in the digital PR industry
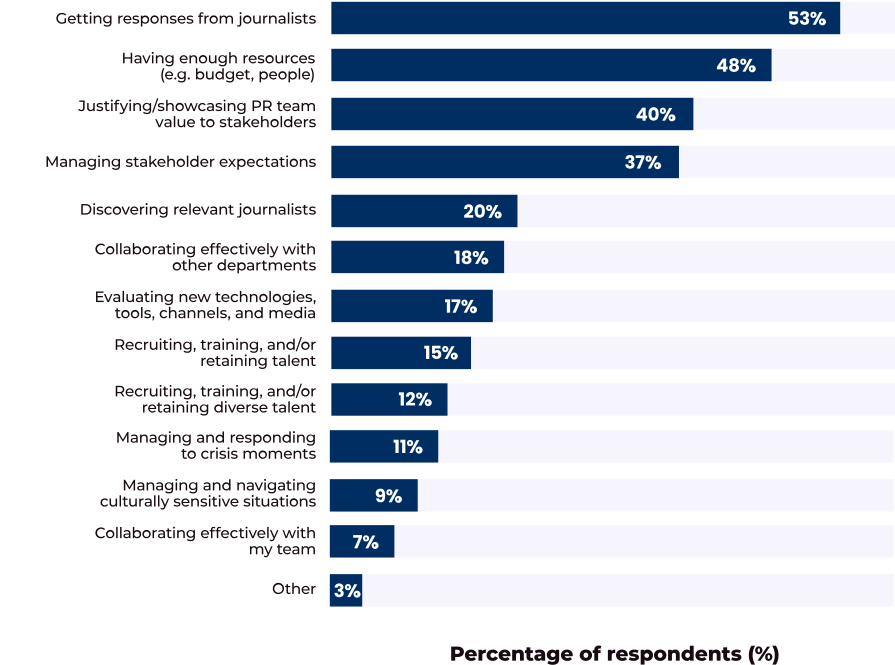
In terms of the biggest challenges faced in the digital PR industry, more than half (53%) of those surveyed by Superlinks claimed that getting responses from journalists was a significant barrier in the sector.
FIGURE 23: BIGGEST CHALLENGES FACED IN DIGITAL PR
SOURCE: SUPERLINKS
Just under half (48%) felt they didn’t have sufficient resources (i.e. budget and/or people) to complete their work effectively, with two-fifths (40%) of the opinion that they had to justify the value of their PR team to stakeholders. This is perhaps linked to a similar percentage (37%) who believed managing client expectations was a frequent challenge faced in the world of digital PR.
More than half (53%) of those surveyed find getting a response from journalists their biggest barrier to working in digital PR.
Use of social media platforms in the digital PR industry
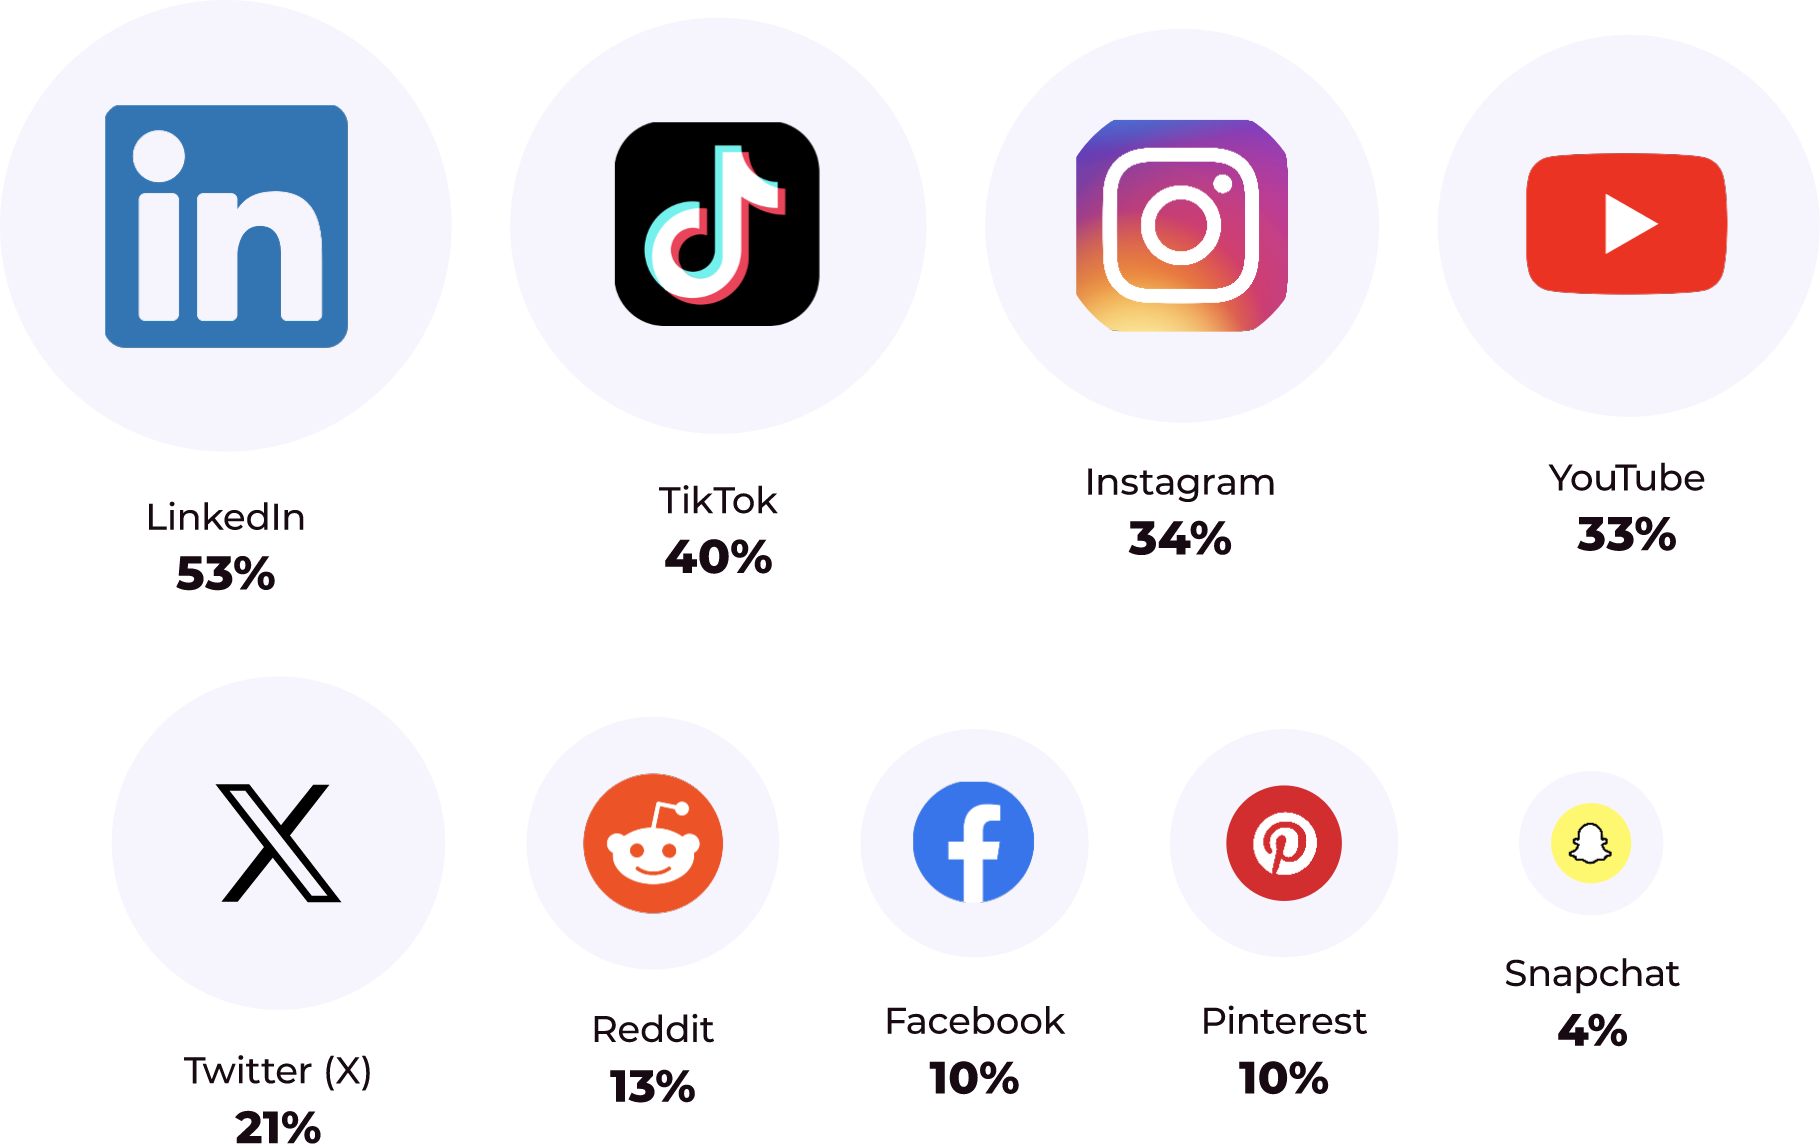
Just over half (53%) of digital PR professionals questioned by Superlinks used LinkedIn as part of their job, followed by around 2 in 5 (40%) who turn to TikTok for their inspiration at work.
FIGURE 24: MOST COMMON SOCIAL MEDIA PLATFORMS USED IN DIGITAL PR
SOURCE: SUPERLINKS
More than half (53%) of those working in digital PR use LinkedIn as their main social media platform.
Incidentally, around a third of digital PR specialists use either Instagram (34%) or YouTube (33%), with just over a fifth (21%) opting for Twitter (X).
Digital PR cost statistics
Average cost of digital PR
Link-building costs vary according to many factors, such as domain rating, site traffic, relevance, link placement, anchor text, and more.
According to research by uSERP, the average cost for low-authority links is around $300 per link and can cost anywhere from $500 to $2,000 for digital PR, high-authority contextual backlinks.
FIGURE 25: AVERAGE SPENDING ON LINK BUILDING EACH MONTH
SOURCE: USERP
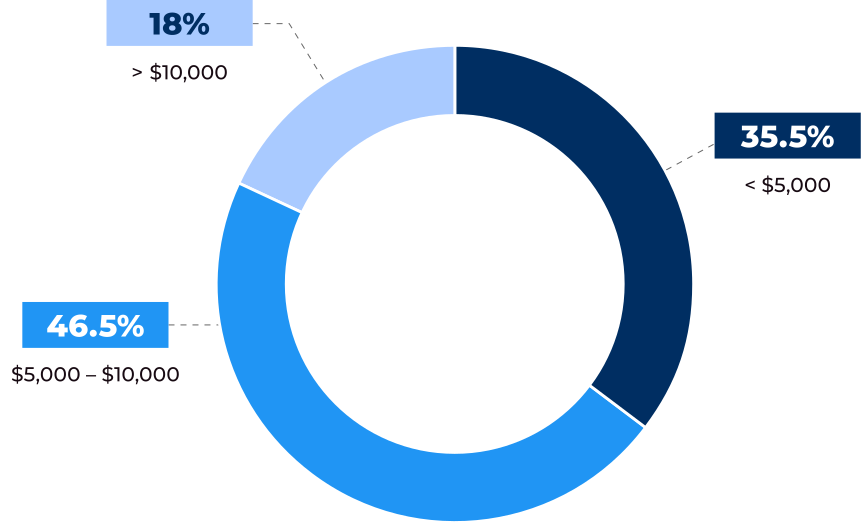
The majority of companies surveyed by uSERP (46.5%) spend somewhere between $5,000 and $10,000 a month on digital PR and link-building services, with more than a third (35.5%) opting for typical monthly costs of less than $5,000.
Incidentally, less than a fifth (18%) claimed to spend more than $10,000 a month on acquiring digital PR links for their business.
FIGURE 26: BUDGET ALLOCATION IN DIGITAL PR (2023 VS. 2024)
SOURCE: SUPERLINKS
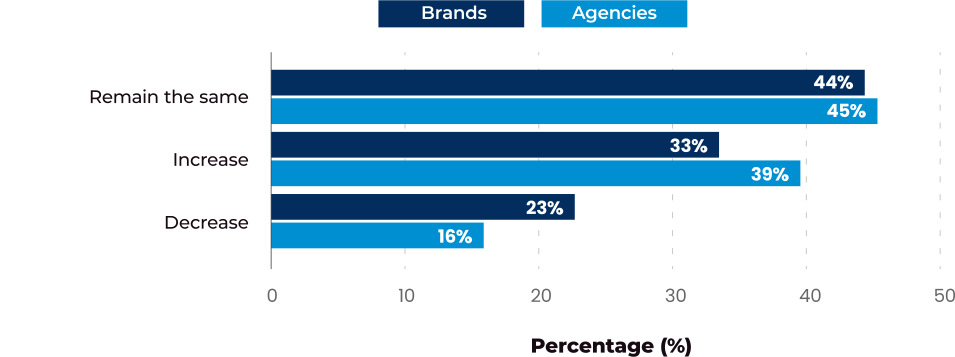
According to survey data by Superlinks, almost half of brands (44%) and agencies (45%) plan to make no changes to their digital PR budget between 2023 and 2024.
Incidentally, around two-fifths (39%) of search and digital marketing agencies plan to increase their annual spending on digital PR compared to a third (33%) of brands. Almost a quarter (23%) of those brands surveyed by Superlinks were looking to decrease their budget for 2024, contrasted by 1 in 6 (16%) agencies.
Digital PR market statistics
The global digital PR service market was worth an estimated $12.3 billion in 2023. By 2032, this could grow to $25.4 billion, at a compound annual growth rate (CAGR) of around 8.3%.
This growth is fuelled by several factors, including:
An expanding reliance on digital platforms for brand communication
The growing importance of online reputation management
The rising need for brands to interact with audiences in more creative ways
Increased digitisation across multiple sectors
The growing popularity of social media as a way of engaging with customers
Technological advancements in data analytics and AI.
By 2032, the global digital PR service market could be worth $25.4 billion - more than double (+106.5%) compared to 2023 estimates.
Popularity of digital PR over time
Most searched digital PR terms of 2025
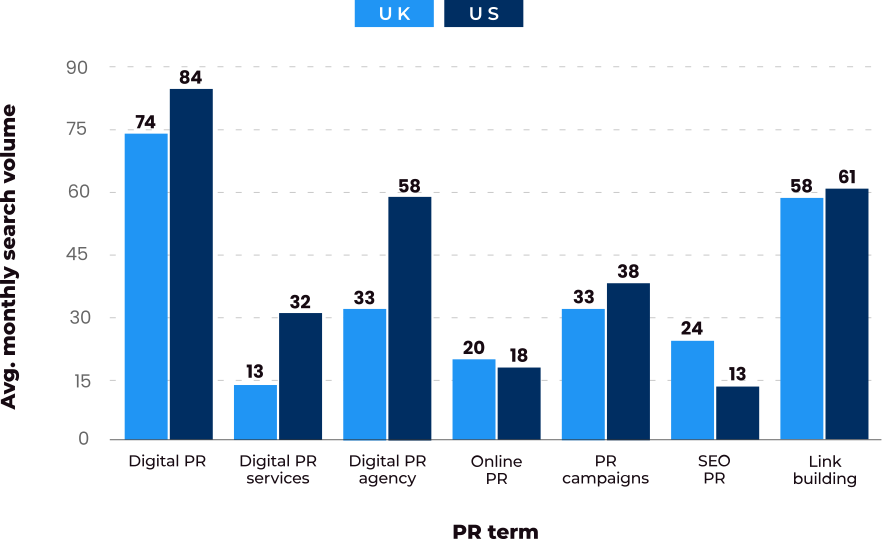
Based on current trends, ‘digital PR’ will be the most searched digital PR term in the UK and the US throughout 2025, with average monthly searches of 74 and 84, respectively.
This suggests the phrase ‘digital PR’ will be around a quarter (24.2%) more popular in the UK and almost a third (31.7%) more commonly searched in the US for 2025, compared to ‘link building’ in second place.
‘Digital PR’ has between 74-84 monthly searches on average in the UK and the US.
SOURCE: REBOOT ONLINE VIA GOOGLE TRENDS
In the UK, ‘digital PR agency’ and ‘PR campaigns’ are both expected to have an average search volume of 33 per month in 2025. Comparative figures for the US place the potential keyword traffic at 58 and 38 per month, respectively, meaning they should still be relatively popular terms by comparison for 2025.
Looking to source the expertise of a digital PR agency but don’t know where to start? Explore our digital PR services to see how the right strategy can build authority, visibility, and relevant coverage for your brand.
As the expected most searched digital PR term in the UK for 2025, the search popularity of the phrase ‘digital PR’ has been on a general upward trend since 2008. With an average of 31 searches per month, it reached a peak of 76 in 2024 – an increase of more than double (145.2%) in the space of 12 years.
FIGURE 28: MOST COMMONLY SEARCHED DIGITAL PR TERMS IN THE UK (2004-25)
SOURCE: REBOOT ONLINE VIA GOOGLE TRENDS
NOTE: 2025 DATA HAS BEEN FORECASTED USING HISTORIC TRENDS
By contrast, ‘link building’ has remained a popular digital PR search term since 2005, with a series of fluctuations in its search volume data in the years up to 2024.
As of 2005, an average of 16 searches per month took place in the UK for ‘link building’, rising to a peak of 76 in 2011. This represented an increase in popularity of almost quadruple (+375%) over 6 years. Its average monthly search traffic dropped to 35 in 2018 before rising again to 75 per month in 2020 and falling to 55 per month just 4 years later.
Incidentally, average monthly searches for ‘digital PR agency’ in the UK only really took off from 2020 onwards, where monthly traffic has varied year-on-year between 20-55 searches per month.
For more information, check out our guide on ‘what is a digital PR agency?’ and how they can help secure high-quality backlinks via online campaigns and content creation.
FIGURE 29: MOST COMMONLY SEARCHED DIGITAL PR TERMS IN THE US (2004-25)
NOTE: 2025 DATA HAS BEEN FORECASTED USING HISTORIC TRENDS
Similar to the UK, search volumes for the term ‘digital PR' have generally grown over time, rising from an average of 16 monthly searches in 2005 up to 83 per month in 2024 – a rise of 418.8% (or around 5 times the amount) in just under 2 decades.
Average monthly searches for ‘link building’ also followed a similar upward trend during this period, almost tripling in popularity (+275.3%).
Conversely, typical monthly search volumes for phrases such as ‘online PR’ and ‘SEO PR’ have gradually declined in the US over time to around 16-18 searches per month as of 2024.
Average search traffic for ‘online PR’ reached a peak in 2015 at around 75 searches per month. This equates to a fall in popularity of more than three-quarters (78.7%) between 2015-24.
Likewise, the highest average monthly search volume in the US for ‘SEO PR’ was in 2011, at 30. This represents a decrease of two-fifths (40%) in typical searches for this phrase over 13 years.
Digital PR FAQs
What is digital PR?
Digital PR is a series of marketing strategies to help boost a brand’s online presence, visibility, and awareness. This focuses mainly on earning backlinks from high-authority websites, online publications, and outlets to drive SEO growth for the site receiving those links.
How to do digital PR?
To do digital PR, you need to have knowledge of the industry and an understanding of how it operates to ensure your campaigns are successful.
A lot of this will come down to meticulous preparation and planning of your digital PR campaign, as well as a rigorous set of processes, including:
Identifying your target audience - who is your target market? Who might be interested in your product/brand/what you have to offer? What are their interests, pain points, and motivations?
Set clear goals - make sure you have clearly defined KPIs relating to the quality and quantity of backlinks for each campaign to help measure its relative success at the end.
Build relationships - reach out to influential people in the industry, journalists, and thought leaders to grow your authority and reputation as the go-to people for that particular topic.
Ideation and brainstorming - spend time coming up with your strongest, best, and brightest ideas for your digital PR campaigns.
Keywords - which keywords do you want to rank for? These should underpin everything that you do, so it’s worth investing time in some quality keyword research and SERP analysis before you start formulating your digital PR ideas.
Consider outsourcing - if you don’t have the time or resources to do digital PR yourself, then you may want to pay a freelancer or digital PR agency to do this for you. This may seem like an added expense, but you can tap into their expertise, knowledge, and experience, which will allow you time to focus on other aspects of running your business.
Why digital PR is important?
Digital PR is important for many reasons, such as:
Improving brand awareness and online visibility.
Building a reputation as a trusted, authoritative company within a given industry.
Helping a company to rank higher on the search engine results pages (SERPs) and drive more traffic (i.e., customers) to its site. This should lead to better conversion rates, sales, and associated revenue.
Increasing customer engagement and strengthening brand loyalty.
Providing an advantage over the competition and staying ahead of the market.
Earn backlinks from high-authority websites to help boost online rankings.
What is an example of a digital PR strategy?
One example of a digital PR strategy is link building (securing backlinks from high-authority websites to boost online rankings and credibility). However, there are many other examples, including:
Search Engine Optimisation (SEO) to improve search engine rankings and online visibility
Influencer marketing (working with notable people in your industry to promote your brand and increase exposure)
Email marketing (sending out emails to entice people towards your brand and convert them into customers)
What is the difference between traditional PR, digital PR and AiPR®?
The main differences between traditional PR, digital PR and AiPR® come down to what each activity is trying to influence.
Traditional PR primarily focuses on brand awareness, reputation and public perception. Campaigns often use media coverage, interviews, events and other forms of communication to reach customers, stakeholders and the wider public.
Digital PR has a stronger focus on online visibility and search performance. Campaigns are created to earn relevant media coverage and backlinks, often through original data, expert commentary, reactive stories and other newsworthy content.
AiPR® focuses on how AI systems understand, cite and recommend a brand. It uses many of the same foundations as Digital PR, but with greater focus on the signals AI systems use when retrieving and summarising information, such as third-party citations, contextual relevance and consistent brand associations.
There is plenty of overlap between the three, and they can often work together. However, understanding the differences between traditional PR, digital PR and AiPR® can help you choose the right activity based on whether your priority is brand perception, search visibility or visibility in AI answers.
A link from one website to another – also referred to as an inbound or incoming link.
Digital PR
The strategic use of online platforms and media to boost brand awareness, improve a company’s online visibility, and bolster its reputation amongst its target audience.
Domain authority
A metric developed by Moz that predicts how likely a website is to appear on the search engine results pages (SERPs), ranging from 1 (very unlikely) to 100 (very likely).
Domain rating
A metric used to determine the quality and size of a website’s backlink profile and its ability to rank on search engines, ranging from 1 to 100.
Open rate
The proportion of recipients who open an email out of the total number that were delivered.
Organic traffic
The number of people who visit a website via unpaid (i.e., organic) search results.
Referral traffic
The number of visitors to a website that arrive from a hyperlink (or referral link) on another website.
Response rate
The proportion of people who complete a given task (i.e., replying to an email or completing a survey) from the total number of people who were invited to complete the task.
Sentiment analysis
The process of computationally analysing digital text to determine whether the emotional meaning behind it is positive, negative, or neutral.
Subject line
A brief line of text at the top of an email that summarises its content. This is normally the first thing a recipient will read and can be a determining factor as to whether they open the email or not.
Reboot Online - Thought Leadership in Digital PR (whitepaper)
Our study aimed to assess the media landscape of different target countries using Muckrack to quantify 371,631 articles across various searched categories. This was done for articles stretching back over 2 years from June 2024. The total published articles available through Muckrack were also obtained to quantify the search terms.
The Muchrack database was searched for key terms across the following digital PR campaign types:
Index study
Data
Survey
Infographic
Expert comment
AI predicts
Mapped
These search terms were specific to narrow down typical campaign structures and exclude any irrelevant results.
A representative sample for each campaign type was downloaded to include article name, article snippet, unique visitor counts, media outlet, and article sentiment (positive, negative, and neutral) for further insight.
Classification of the articles took place through Meta’s Llama 3 uncensored large language model.