
- Top 10 must-know website statistics for 2026
- Global internet usage statistics
- Global website traffic statistics
- Statistics on the world’s most popular websites
- Global website search engine traffic statistics
- Global website UX Statistics
- Global average website bounce rate statistics
- Average page load time statistics
- Global web design statistics
- Website cost statistics
- Global CMS statistics
- Business website statistics
- Global website hosting statistics
- Global website security statistics
- Website statistics FAQs
- Sources
_____ WEBSITE STATS
Website statistics report 2026

The web is bigger and busier than ever. As of 2026, there are 1.4 billion websites worldwide. Yet only around one in seven are actively maintained, leaving 205 million live sites competing for attention.
Despite this huge volume, growth shows no signs of slowing, with more than 252,000 new websites launched every day, nearly three every second.

In this website statistics report, we’ve collated the latest web stats and facts to give you a clear snapshot of the digital landscape in 2026. This includes:
- Insights into website traffic trends, including the world’s most visited websites.
- User behaviour metrics, such as average engagement and session duration.
- Key B2B eCommerce statistics.
We’ve also looked at web design and development trends, from the average cost of building a website to the most used CMS systems, to understand how businesses are building, optimising, and competing online right now.
Top 10 must-know website statistics for 2026
Users spend an average of 11 minutes and 12 seconds on a website, according to our January 2026 analysis of the top 100 most visited sites [Reboot].
Google, the world’s most popular website, dropped 33.15% in monthly traffic between January and December 2025 [Reboot].
Website traffic is becoming increasingly concentrated, with Google, Facebook, and YouTube alone driving the majority of global visits [Reboot].
Among the top 100 websites, weather.com retains users’ attention for the shortest time, at just three minutes and 38 seconds [Reboot].
Users spend over 33 minutes on WhatsApp, surpassing the time spent on YouTube [Reboot].
The average bounce rate is 45.28% across the top 10 websites, with WhatsApp recording the highest rate (60.78%) [Reboot].
The top 100 websites take, on average, 8.28 seconds to load [Reboot].
Website-building packages cost £79.15 per month on average, with the median cost sitting at £17.10 [Reboot].
ChatGPT loses market share, falling to 68%, with Gemini being the biggest winner.
Nearly three-quarters of the global population are online, as of October 2025 [We Are Social/Meltwater].
Global internet usage statistics
As of October 2025, there were an estimated 6.04 billion internet users worldwide, indicating that nearly three-quarters (73.2%) of the global population are connected online.
The world’s highest internet penetration rate is in Northern Europe, where nearly 98 out of every 100 people (97.7%) are connected to the internet.
While the proportion of internet users in East Asia is lower at 90.1%, the 1.49 billion people online in this region represent 24.67% of the total internet population.
In terms of social media, there are a reported 5.66 billion user identities globally, equivalent to over two-thirds (68.7%) of the total population.
Global website traffic statistics
How many websites are there in the world?
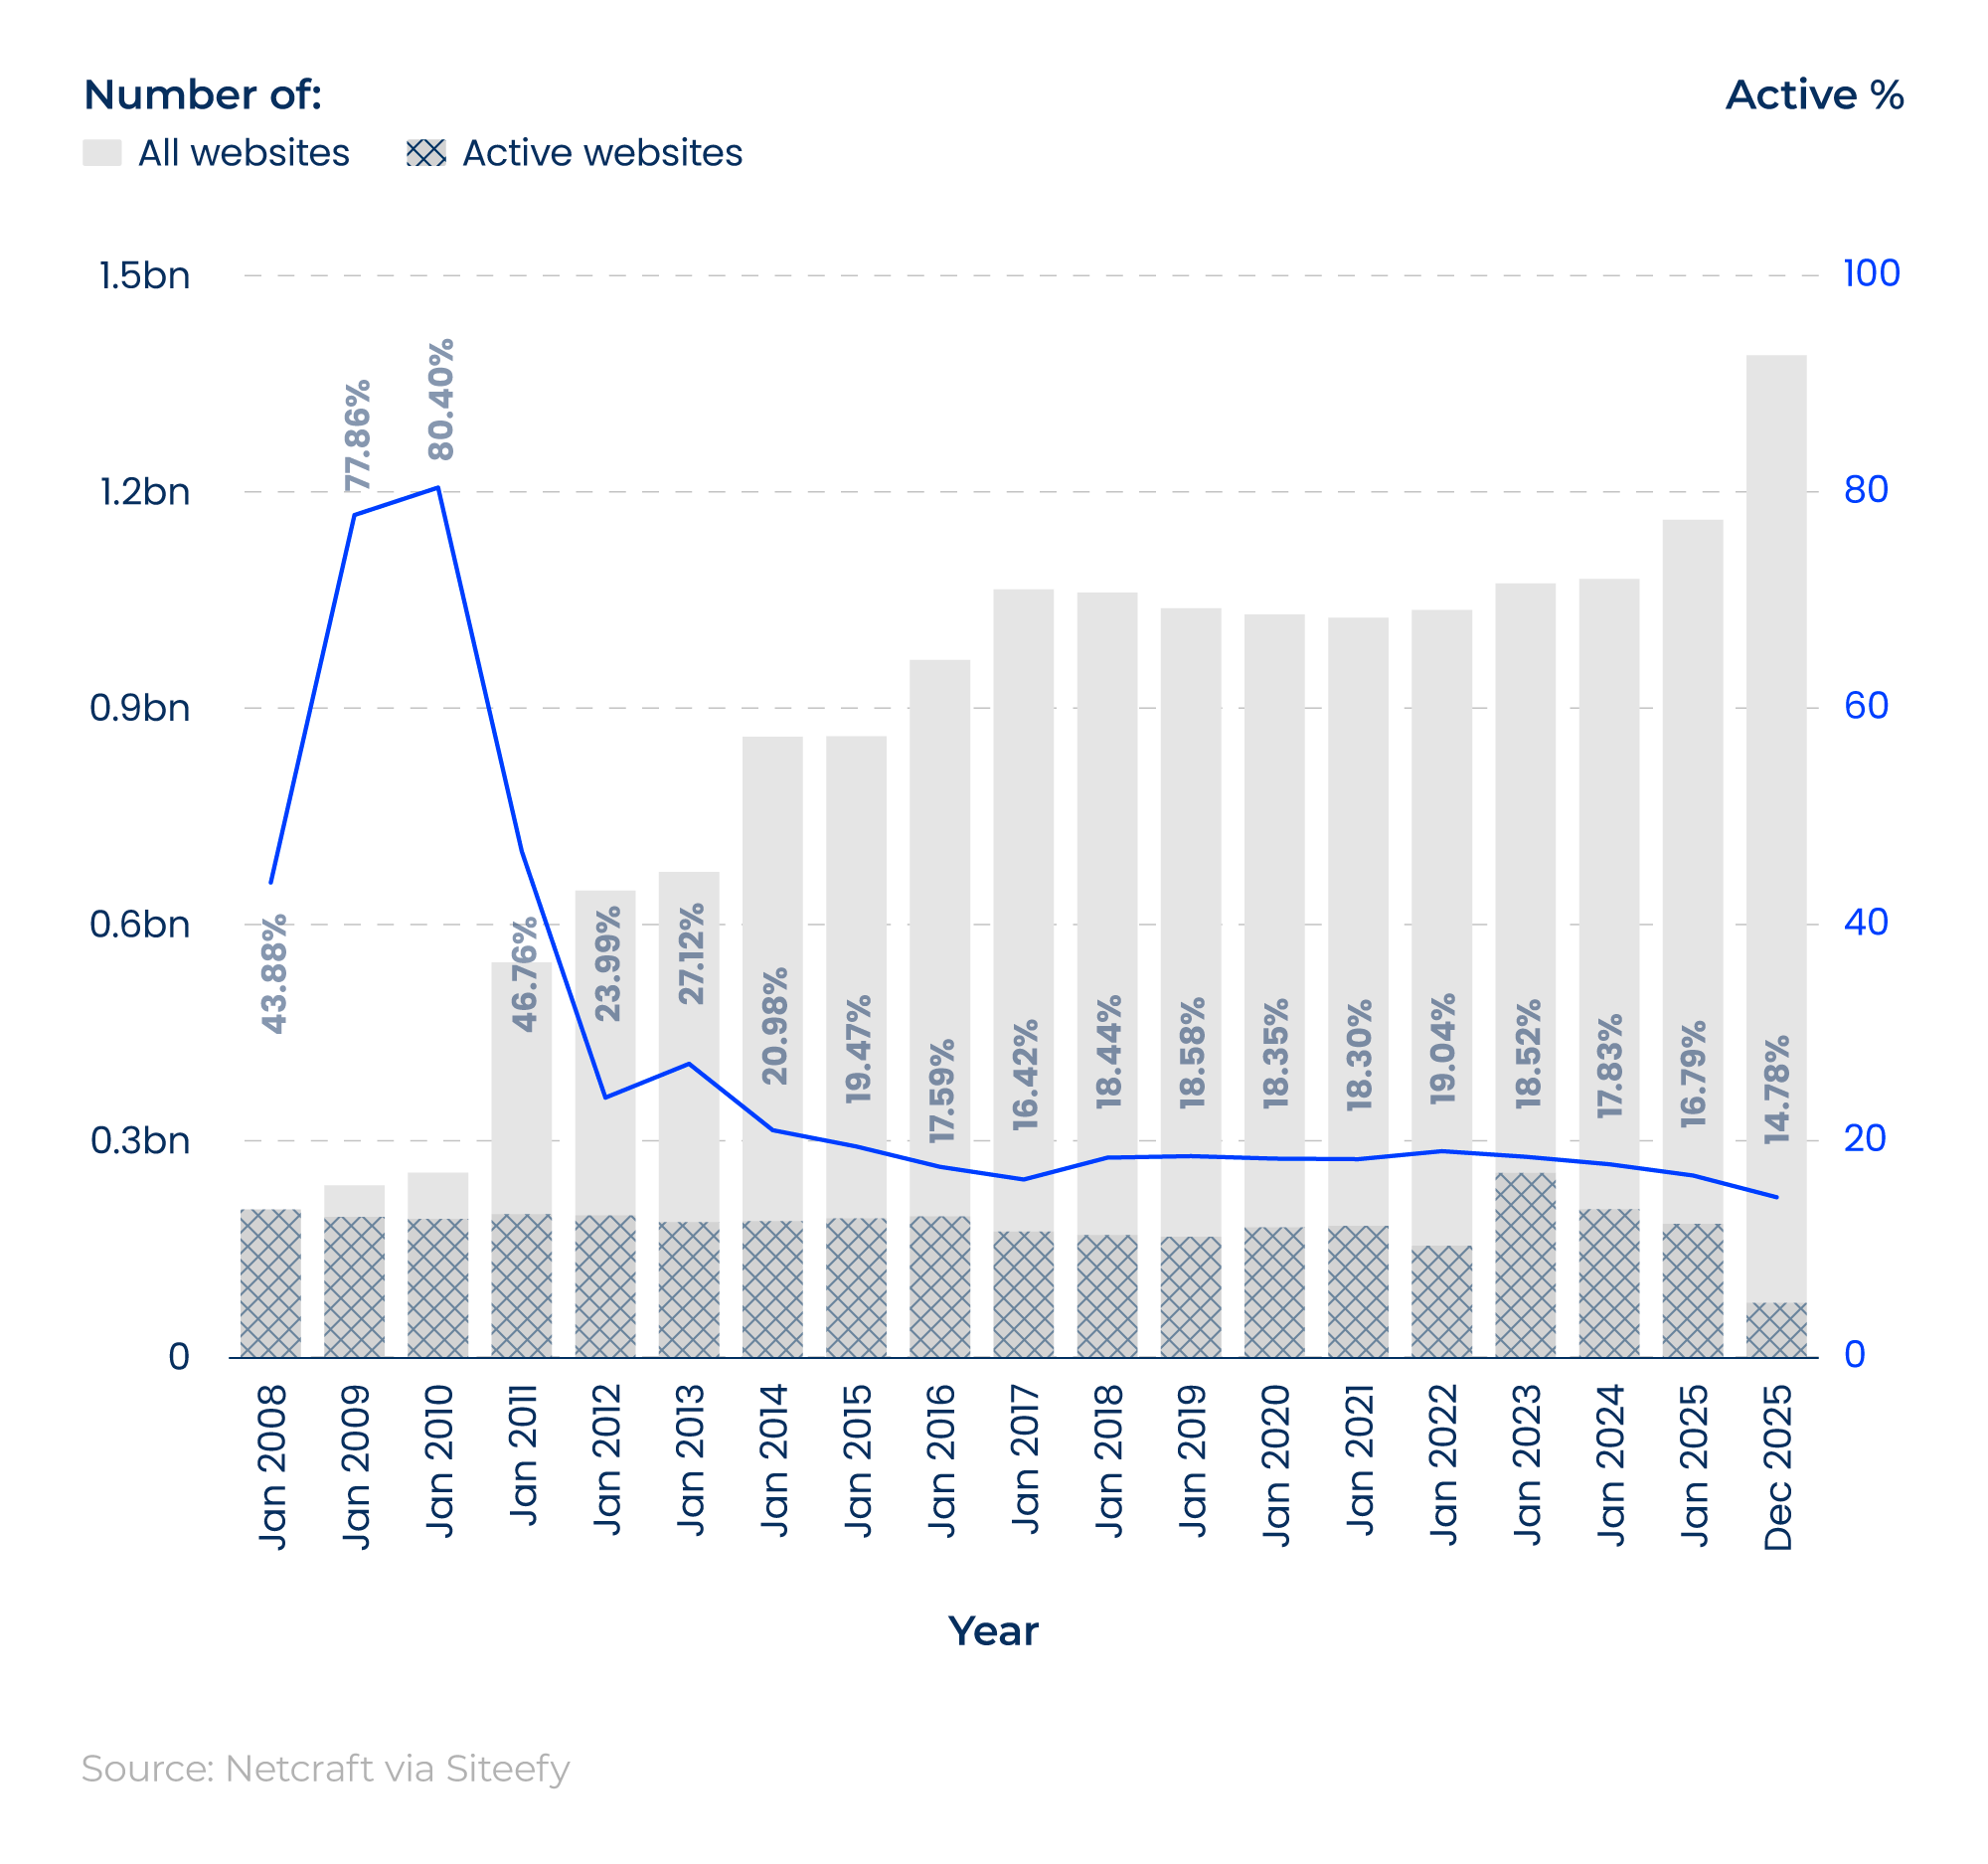
It’s estimated that there were nearly 1.4 billion websites worldwide by the end of 2025. Around 205 million of these were active, accounting for around one in seven websites.
Since 2013, the number of websites worldwide has more than doubled, from around 670 million to 1.4 billion, an increase of 106.5%.
Global number of websites (total and active) over time (2008 to 2025)
| Year | All websites | Active websites |
|---|---|---|
| Jan 2008 | 173,123,000 | 75,959,000 |
| Jan 2009 | 238,027,000 | 185,300,000 |
| Jan 2010 | 255,839,000 | 205,691,000 |
| Jan 2011 | 547,211,000 | 255,810,000 |
| Jan 2012 | 646,987,000 | 155,190,000 |
| Jan 2013 | 672,985,000 | 182,499,000 |
| Jan 2014 | 860,467,000 | 180,468,000 |
| Jan 2015 | 860,926,000 | 167,659,000 |
| Jan 2016 | 966,811,000 | 170,047,000 |
| Jan 2017 | 1,064,660,000 | 174,791,000 |
| Jan 2018 | 1,060,403,000 | 195,540,000 |
| Jan 2019 | 1,038,563,000 | 192,980,000 |
| Jan 2020 | 1,030,111,000 | 189,021,000 |
| Jan 2021 | 1,025,456,000 | 187,637,000 |
| Jan 2022 | 1,036,099,382 | 197,220,000 |
| Jan 2023 | 1,073,166,232 | 198,834,218 |
| Jan 2024 | 1,079,154,539 | 192,375,760 |
| Jan 2025 | 1,161,445,625 | 194,973,562 |
| Dec 2025 | 1,389,596,802 | 205,383,071 |
Source: Netcraft via Siteefy
Between 2014 and 2015, the total number of websites experienced limited growth, rising by just 0.05%.
The total number of global websites surpassed one billion for the first time in 2017. While this figure has remained above one billion, the total number of websites underwent a continual downward trend between 2018 and 2021, falling to 1.025 billion.
Since 2022, continual growth has been recorded in this area. The 1.073 billion seen in 2023 was the first time the total number of websites exceeded the benchmark set in 2017.
Global top-level domain (TLD) statistics by the number of registered domains
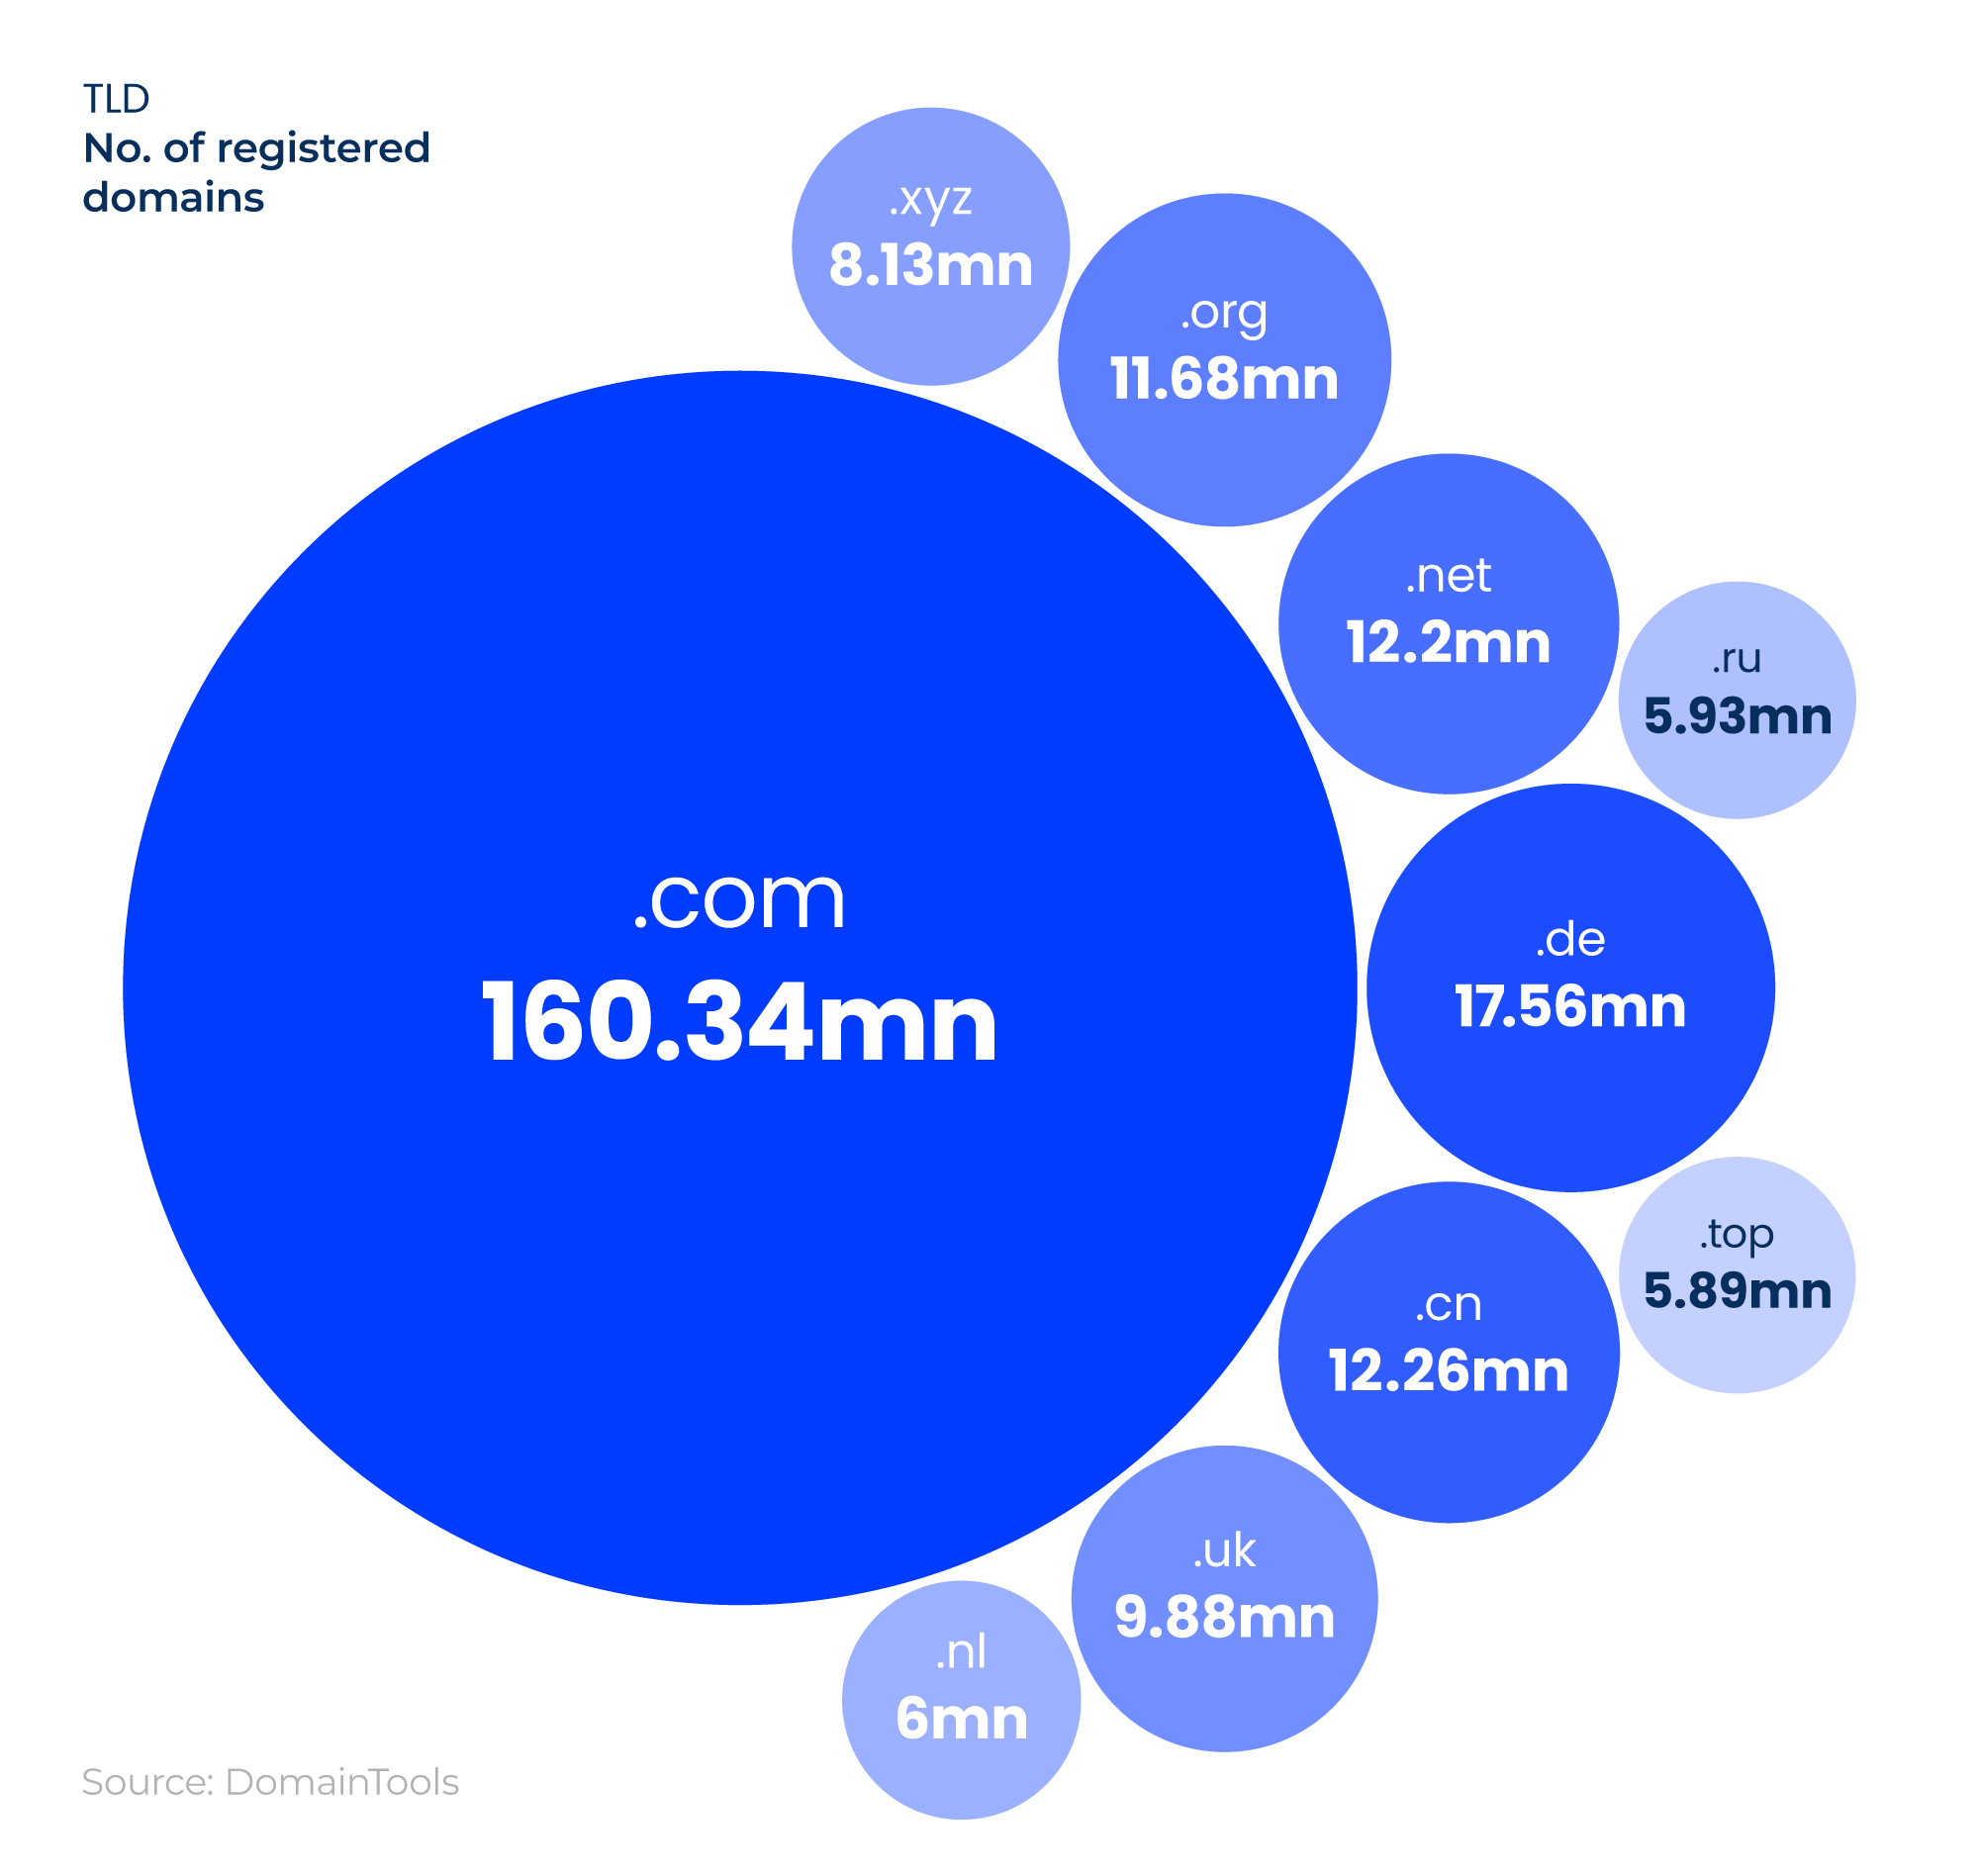
The .com domain dominates the top-level domain (TLD) market, with almost nine times as many registrations as .de (Germany) and .cn (China).
As of 2026, there were approximately 160.34 million websites worldwide with a .com domain, accounting for more than three-quarters (78.1%) of all active websites and 11.5% of all websites.
Statistics on the world’s most popular websites
Most visited websites in the world
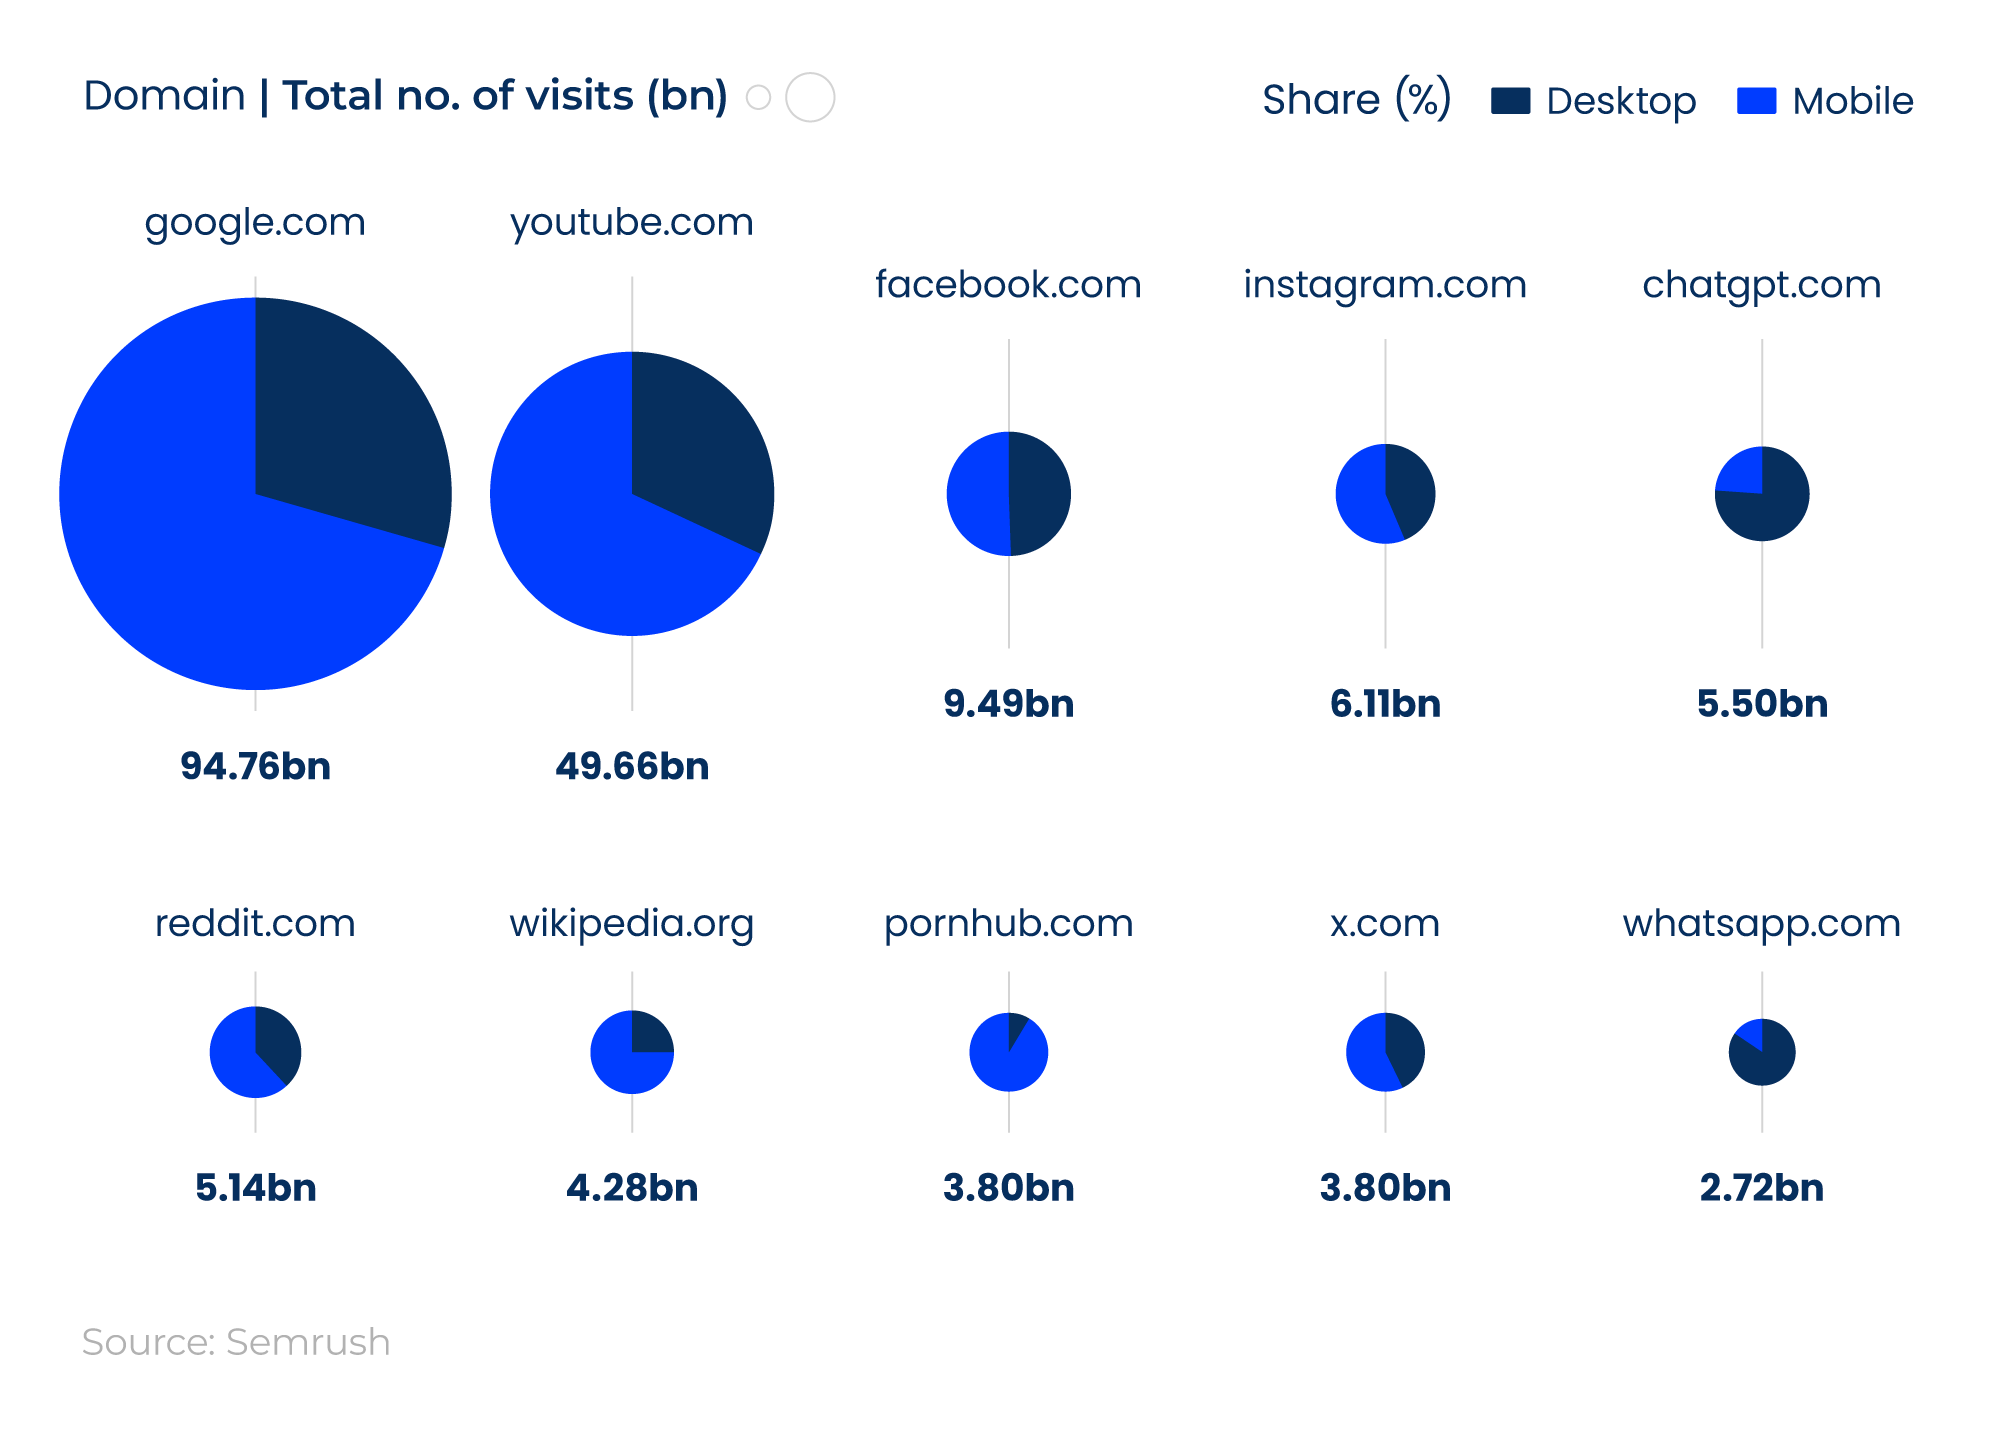
Website visitor statistics from Semrush show that, as of January 2026, google.com was the most visited website in the world (94.76 billion visits).
The vast majority (70.5%) of people use their mobile during this time to visit the site, accounting for 66.8 billion visits worldwide.
Social media platforms largely dominate the top 10 most visited websites in the world, with facebook.com being the most popular, with 9.49 billion visits.
What is website traffic?
Website traffic refers to the number of visits to a website from browsers, users, or searchers.
Most visited websites in the world (January 2026)
| Domain | No. of desktop visits (bn) | Desktop share (%) | No. of mobile visits (bn) | Mobile share (%) |
|---|---|---|---|---|
| google.com | 27.96 | 29.5% | 66.8 | 70.5% |
| youtube.com | 15.97 | 32.2% | 33.7 | 67.9% |
| facebook.com | 4.71 | 49.6% | 4.78 | 50.4% |
| instagram.com | 2.67 | 43.7% | 3.44 | 56.3% |
| chatgpt.com | 4.2 | 76.4% | 1.3 | 23.6% |
| reddit.com | 1.97 | 38.3% | 3.17 | 61.7% |
| wikipedia.org | 1.08 | 25.2% | 3.2 | 74.8% |
| pornhub.com | 0.33 | 8.6% | 3.47 | 91.3% |
| x.com | 1.63 | 42.9% | 2.17 | 57.1% |
| whatsapp.com | 2.31 | 84.9% | 0.42 | 15.3% |
Source: Semrush
Google remained the world’s most commonly visited website throughout 2025 in terms of website traffic statistics, experiencing a peak of 142.24 billion visits in March and a trough of 92.7 billion in April.
Overall, Google’s traffic fell by 33.15% between January (139.95 billion) and December (93.55 billion) 2025.
YouTube visitor statistics during the same period followed a similar pattern, falling by 37.95% from 77.90 billion to 48.34 billion.
Of the top 10 most visited websites in the world in 2025, most experienced their lowest visitor numbers in April, with an average of 17.48 billion across all 10 sites. This is contrasted with the highest visitor figures in March, averaging 27.57 billion.
World’s most commonly visited websites over time (2017 to 2025)
Since 2017, there has been minimal change at the top of the world’s most popular websites.
Reboot analysis shows that:
- As of January 2017, YouTube was the world’s most visited website, with around 18.9 billion views (almost 580 million more than Google for the same month).
- By November 2017, this had widened to almost 3.5 billion in favour of YouTube, with total monthly visits rising to 18.9 billion and Google’s dropping to around 15.4 billion.
- From January 2018, YouTube and Google had swapped places, with the latter’s monthly visits rising to 39.31 billion. YouTube, by contrast, dropped to second with 25.17 billion.
- By August 2021, YouTube’s monthly visitor numbers had regained ground on Google, a position it held until April 2022.
- Google regained the top spot in May 2022, with YouTube’s numbers dropping to around 41.19 billion, compared with Google’s 72.25 billion.
Share of web traffic by device
Throughout 2025, Google’s desktop viewers fluctuated between 23.85 billion (June) and 38.86 billion (February), with an overall decrease in viewership as the year progressed.
In fact, ChatGPT was the only website to see an overall increase in desktop viewer numbers between January and December 2025, rising by 11.73%.
World’s most visited websites on desktops over time (2018 to 2025)
Desktop website traffic trends since 2018 show a shift away from traditional browsing, although the scale of this varies by platform.
Across major social media and entertainment sites, desktop usage has fallen significantly. YouTube’s desktop visits dropped from 18.87 billion in January 2018 to 13.84 billion in December 2025, a decline of 26.66%. However, the site saw a much higher recent peak of 23.59 billion in December 2024. This high point sat within a strong year for YouTube, with desktop traffic sitting above 20 billion between April 2024 and March 2025, a feat not seen in the months since.
Facebook statistics show a steeper long-term drop, down from 5.97 billion to 3.98 billion over the same period, a fall of a third.
In contrast, Google shows strong growth over the same period. Desktop visits increased from 18.29 billion in 2018 to 24.82 billion in 2025, a 35.7% rise, and visits peaked at 39.72 billion in November 2024.
Overall, desktop usage is not uniformly declining; it’s becoming more concentrated in specific use cases. Desktop remains a key channel for search and other query-oriented activities, and it will likely remain so while it is the primary device for work and education.
World’s most commonly visited websites on mobile devices over time (2018 to 2025)
Mobile traffic saw strong growth over the same period, although differences are apparent between legacy social networks and more utility-driven sites.
The most significant increases were seen in large platforms that have successfully scaled mobile usage. YouTube’s mobile visitor count grew from 5.74 billion in January 2018 to 34.50 billion in December 2025, a staggering rise of 501.05%, while Google rose from 23.37 billion to 68.73 billion, a rise of 194.09%.
Other top platforms saw strong growth from smaller bases. Over this period, Instagram more than doubled from 1.53 billion to 3.18 billion in December 2025, while Pornhub increased by 111.80% from 1.61 billion to 3.41 billion.
These trends highlight how mobile-first behaviour has become the dominant viewing channel for visual and content-driven platforms.
In contrast, several established platforms have seen substantial declines in mobile traffic.
Facebook’s mobile viewership dropped from 15.30 billion to 4.43 billion, a decrease of 71.05%, one of the steepest falls among the top websites. Yahoo fell by 25.86% (January 2018-October 2025), while Wikipedia declined by 25.06%.This suggests a loss of relevance or displacement by competing platforms on mobile, while Wikipedia itself points to the impact of AI search summaries and changing search behaviour on social media.
Mobile traffic to websites is characterised by rapid expansion at one end, particularly for Google and YouTube, alongside sharp declines in some legacy sites, notably Facebook. This indicates that mobile growth is not evenly distributed, but rather concentrated among platforms that have successfully adapted to mobile-first user behaviour.
Most popular types of websites in the world
Our statistics on the world’s most visited websites also highlight how the popularity of certain websites has changed over time.
In January 2017, the 10 most popular websites in the world were fairly evenly split between news, entertainment, and service web pages, search engines (Google, Yahoo, and Yandex), and social media (Facebook and VK).
Social media platforms strengthened their positions in 2018. Instagram and Twitter (now X) both entered the global top 10 by mid-to-late 2018, reflecting the increasing time spent on social platforms across the world.
By January 2019, adult entertainment websites became a consistent feature of the global top 10. Platforms including Xvideos, XNXX, and Pornhub, all ranked among the most visited websites, with combined monthly traffic exceeding 10 billion visits, surpassing Wikipedia and highlighting the scale of demand for this industry.
At the same time, the search market consolidated rapidly. By 2020, Google had firmly established its dominance, with significantly higher traffic than competitors such as Yahoo. Yahoo was able to maintain its top 10 position until June 2023 before dropping out entirely (save for a brief return June-September 2025). With around 25 times as many people using Google as Yahoo, this marked the beginning of a more concentrated search landscape.
More recent data from 2023 to 2025 shows a further consolidation of traffic among a small group of platforms. Google and YouTube continue to dominate, while social sites Facebook, Instagram, and Reddit maintain strong but comparatively smaller audiences. Adult entertainment platforms remain present within the top rankings, indicating sustained demand rather than a short-term trend.
At the same time, newer entrants such as ChatGPT have begun to appear among the most visited websites globally. This reflects the growing prominence of AiPR® for AI-driven platforms and indicates a potential shift in how users access information and services online.
LLM usage statistics
According to the latest AI statistics, the global artificial intelligence market was valued at more than $390 billion in 2025 and is expected to reach $3.4 trillion by 2033.
Estimates suggest that, by 2028, more than 36 million Americans alone will use generative AI as their primary search tool. This represents a 100% increase in just four years.
LLM traffic share over time (2024 vs 2025)
| Platform | Traffic share (Dec 2024) | Traffic share (Dec 2025) | Change (percentage points) |
|---|---|---|---|
| ChatGPT (OpenAI) | 87.2% | 68.0% | −19.2 |
| Gemini (Google) | 5.4% | 18.2% | 12.8 |
| DeepSeek | <1% | ~4.0% | 3.0-4.0 |
| Grok (xAI) | <1% | 2.9% | 2.0-2.9 |
| Claude | ~1.5% | 2.0% | 0.5 |
| Perplexity | ~1.0% | 2.1% | 1.1 |
| Copilot | ~1.5% | 1.2% | −0.3 |
| All others | ~3.4% | ~1.6% | −1.8 |
Source: Similarweb via Azoma
ChatGPT is the most popular of these large language models (LLMs), with an average of 557 million users in August 2025.
By the end of the year, around two-thirds of LLM users chose ChatGPT (OpenAI) as their main generative AI tool. While still the largest proportion, this represented a drop of almost a fifth from 12 months earlier.
Gemini accounted for almost a fifth of the LLM traffic share in December 2025, putting it more than four times as popular as DeepSeek.
Interested in levelling up your LLM performance? As a GEO agency, Reboot can help you strengthen your AI visibility by ensuring generative engines understand, trust, and reference your business.
Get in touch
Global website search engine traffic statistics
How much global website traffic comes from search engines?
As of January 2026, almost nine in 10 global searches were conducted on Google.
Global website search statistics by search engine (January 2026)
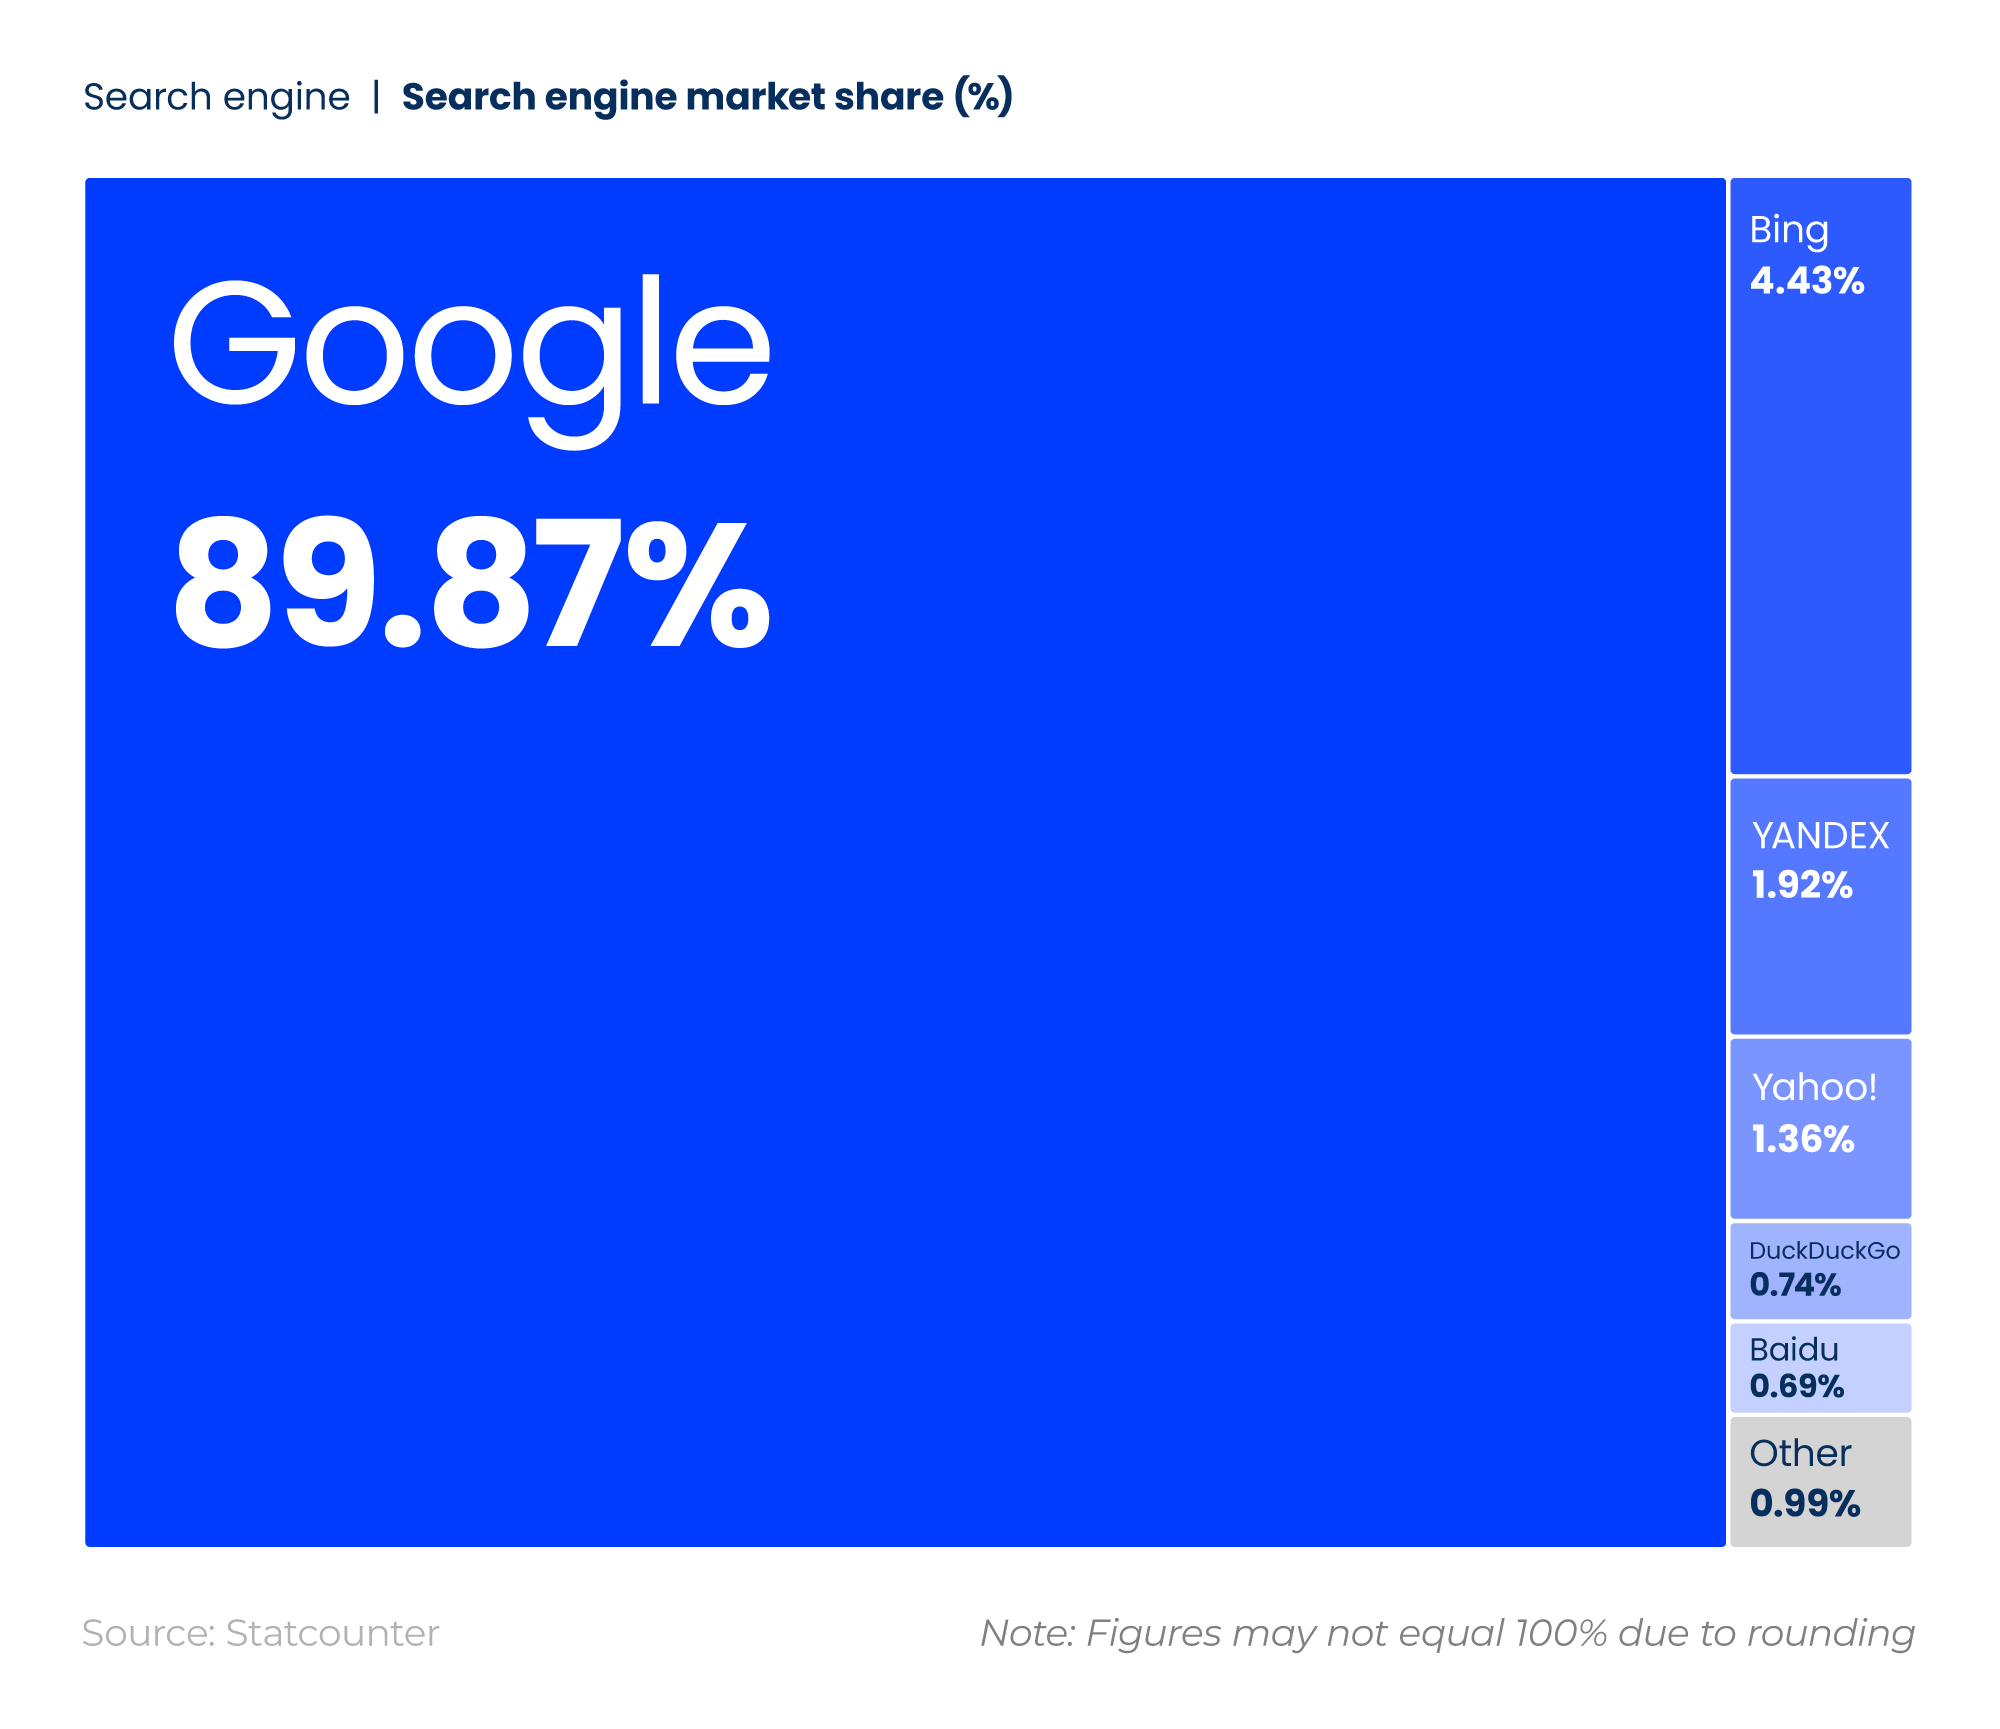
Queries made using Bing accounted for nearly one in 20 online searches. Microsoft’s search engine was the only other to have a market share over 2%, yet this is around 95% lower than Google's.
Global percentage share of web traffic over time
Between 2009 and 2024, Google dominated the global search engine market, fluctuating somewhere between 90% and 93% during this period.
It reached its peak market share in February 2023, at 93.37%.
Average global market share over time by search engine
Bing’s market share has only surpassed 4% 12 times since January 2009. The earliest instance was in January 2011 (4.12%), while the most recent occurrence was in January 2026 (4.43%).
Yahoo’s market share has dropped by more than three-quarters (76.99%) since 2009, when it held second position.
Reboot’s hyper-relevancy projects help your brand build authority, earning organic coverage and driving continuous SEO growth.
Learn more
Global percentage market share of search traffic by device over time
As of January 2026, Google accounted for over four-fifths of the search market from desktop devices. Its 82.79% market share represents a recovery to the 80% threshold, following a brief dip to 79.32% in 2025.
Average global search market share across desktop devices
Google’s desktop share is around eight times larger than that of competitor Bing, with desktop searches using the Microsoft search engine only accounting for a tenth of the total desktop market.
The global market share of Google on desktops reached a peak of 92.04% in May 2012, while Bing’s peak came over a decade later (12.21% in March 2025).
Average global search market share across mobile devices
Google dominated the global mobile market share statistics in January 2026 with 94.49% of the market.
The percentage of global Google searches from mobile devices peaked at 98.39% in August 2010, staggeringly higher than Yahoo, its closest competitor at that point (0.77%). Despite being Google’s greatest competitor for mobile search traffic between 2009 and 2017, Yahoo’s power has since fallen.
As of January 2026, the search engine has only the sixth-greatest market share in this area.
In the wider search environment, Yandex had nearly 50% more mobile web traffic than Baidu during this time, although this accounted for just 1.83% of the overall monthly figures.
Global website UX Statistics
What is the average time spent on a website?
The average session duration on a website (i.e., average time spent on a website) was 11 minutes and 12 seconds when visiting the top 100 most visited websites in January 2026.
Average session duration for the world’s most visited websites (as of January 2026)
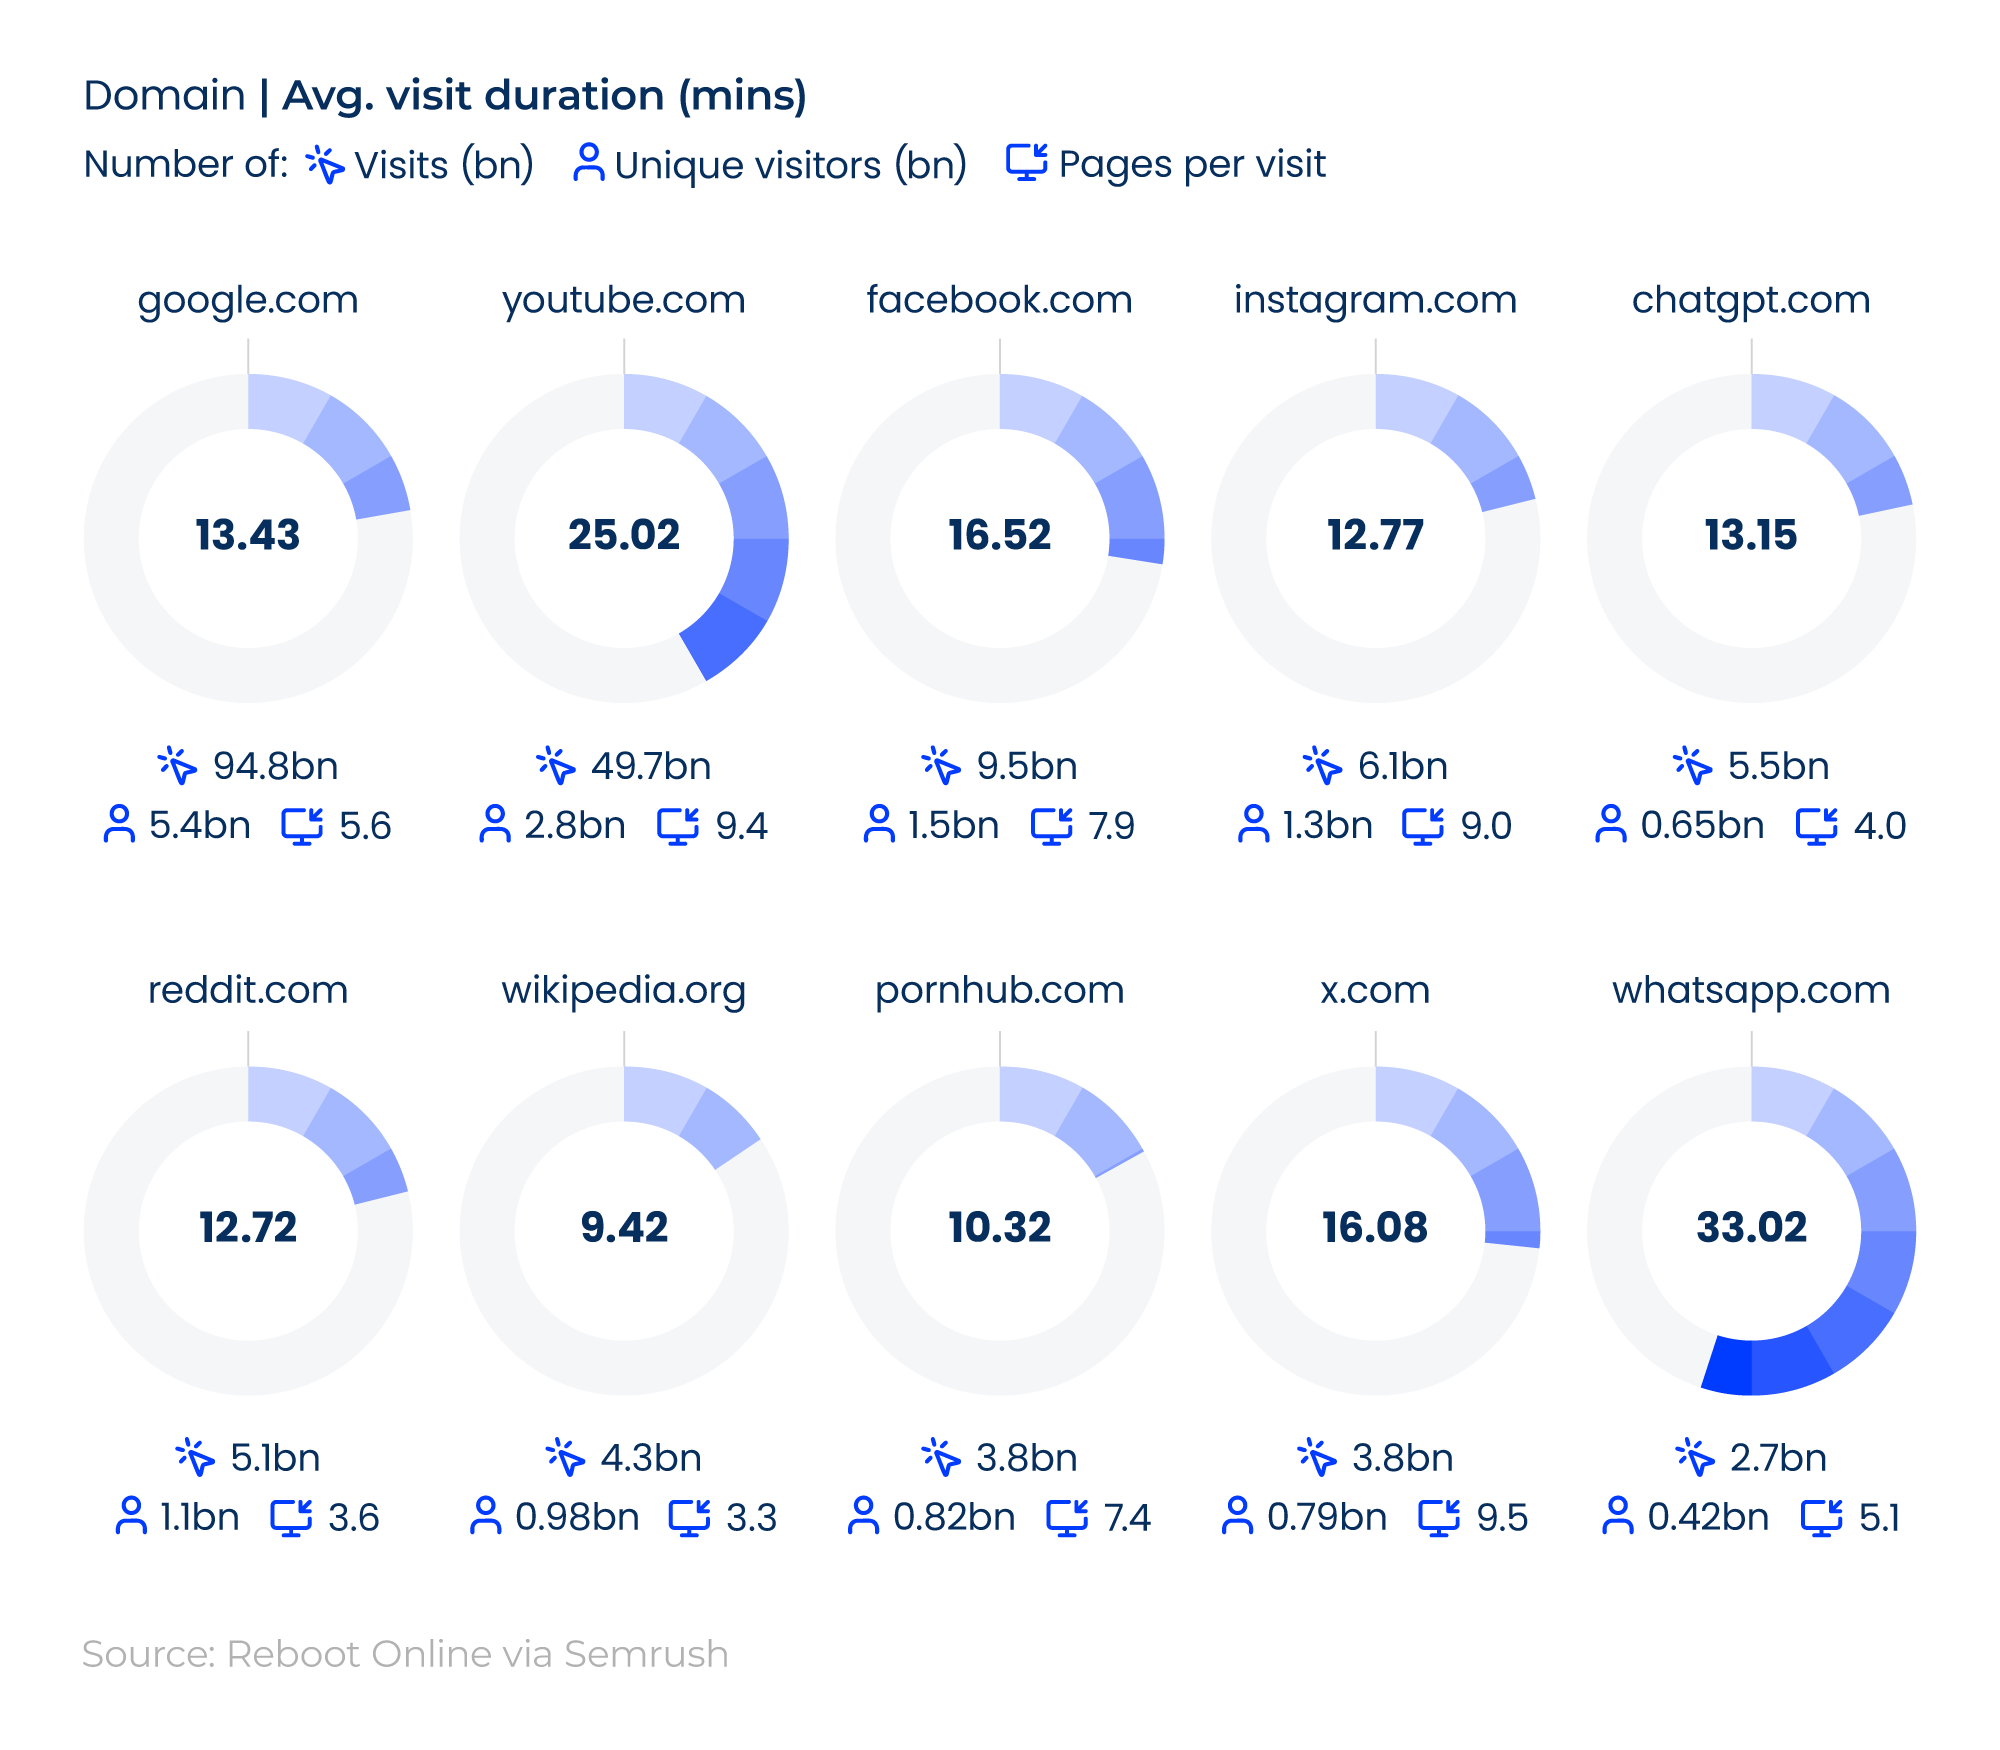
Note: Average visit duration is recorded in minutes to the decimal point. A time of 16.5 would signify 16-and-a-half minutes (i.e., 16 minutes and 30 seconds).
Of the top 10 most visited websites of 2026:
- Global website visitors typically spend the longest on whatsapp.com, at just over 33 minutes. This was almost twice as long as the average Facebook user.
- The average YouTube user spends just over 25 minutes watching videos. This is around double the time spent by those on Google.
- The average visitor to wikipedia.org spent just under 9.5 minutes on the site, almost half the time spent by visitors to x.com.
Further analysis shows that users of x.com and YouTube have the highest number of pages per visit, at 9.5 and 9.4, respectively. This is about three times the number of visitors to Wikipedia.
Did you know?
According to consumer research, people typically read only 28% of the words on a website. Therefore, content structuring is critical to keeping visitors engaged on your website for longer.
Longest average time spent on a website in 2026
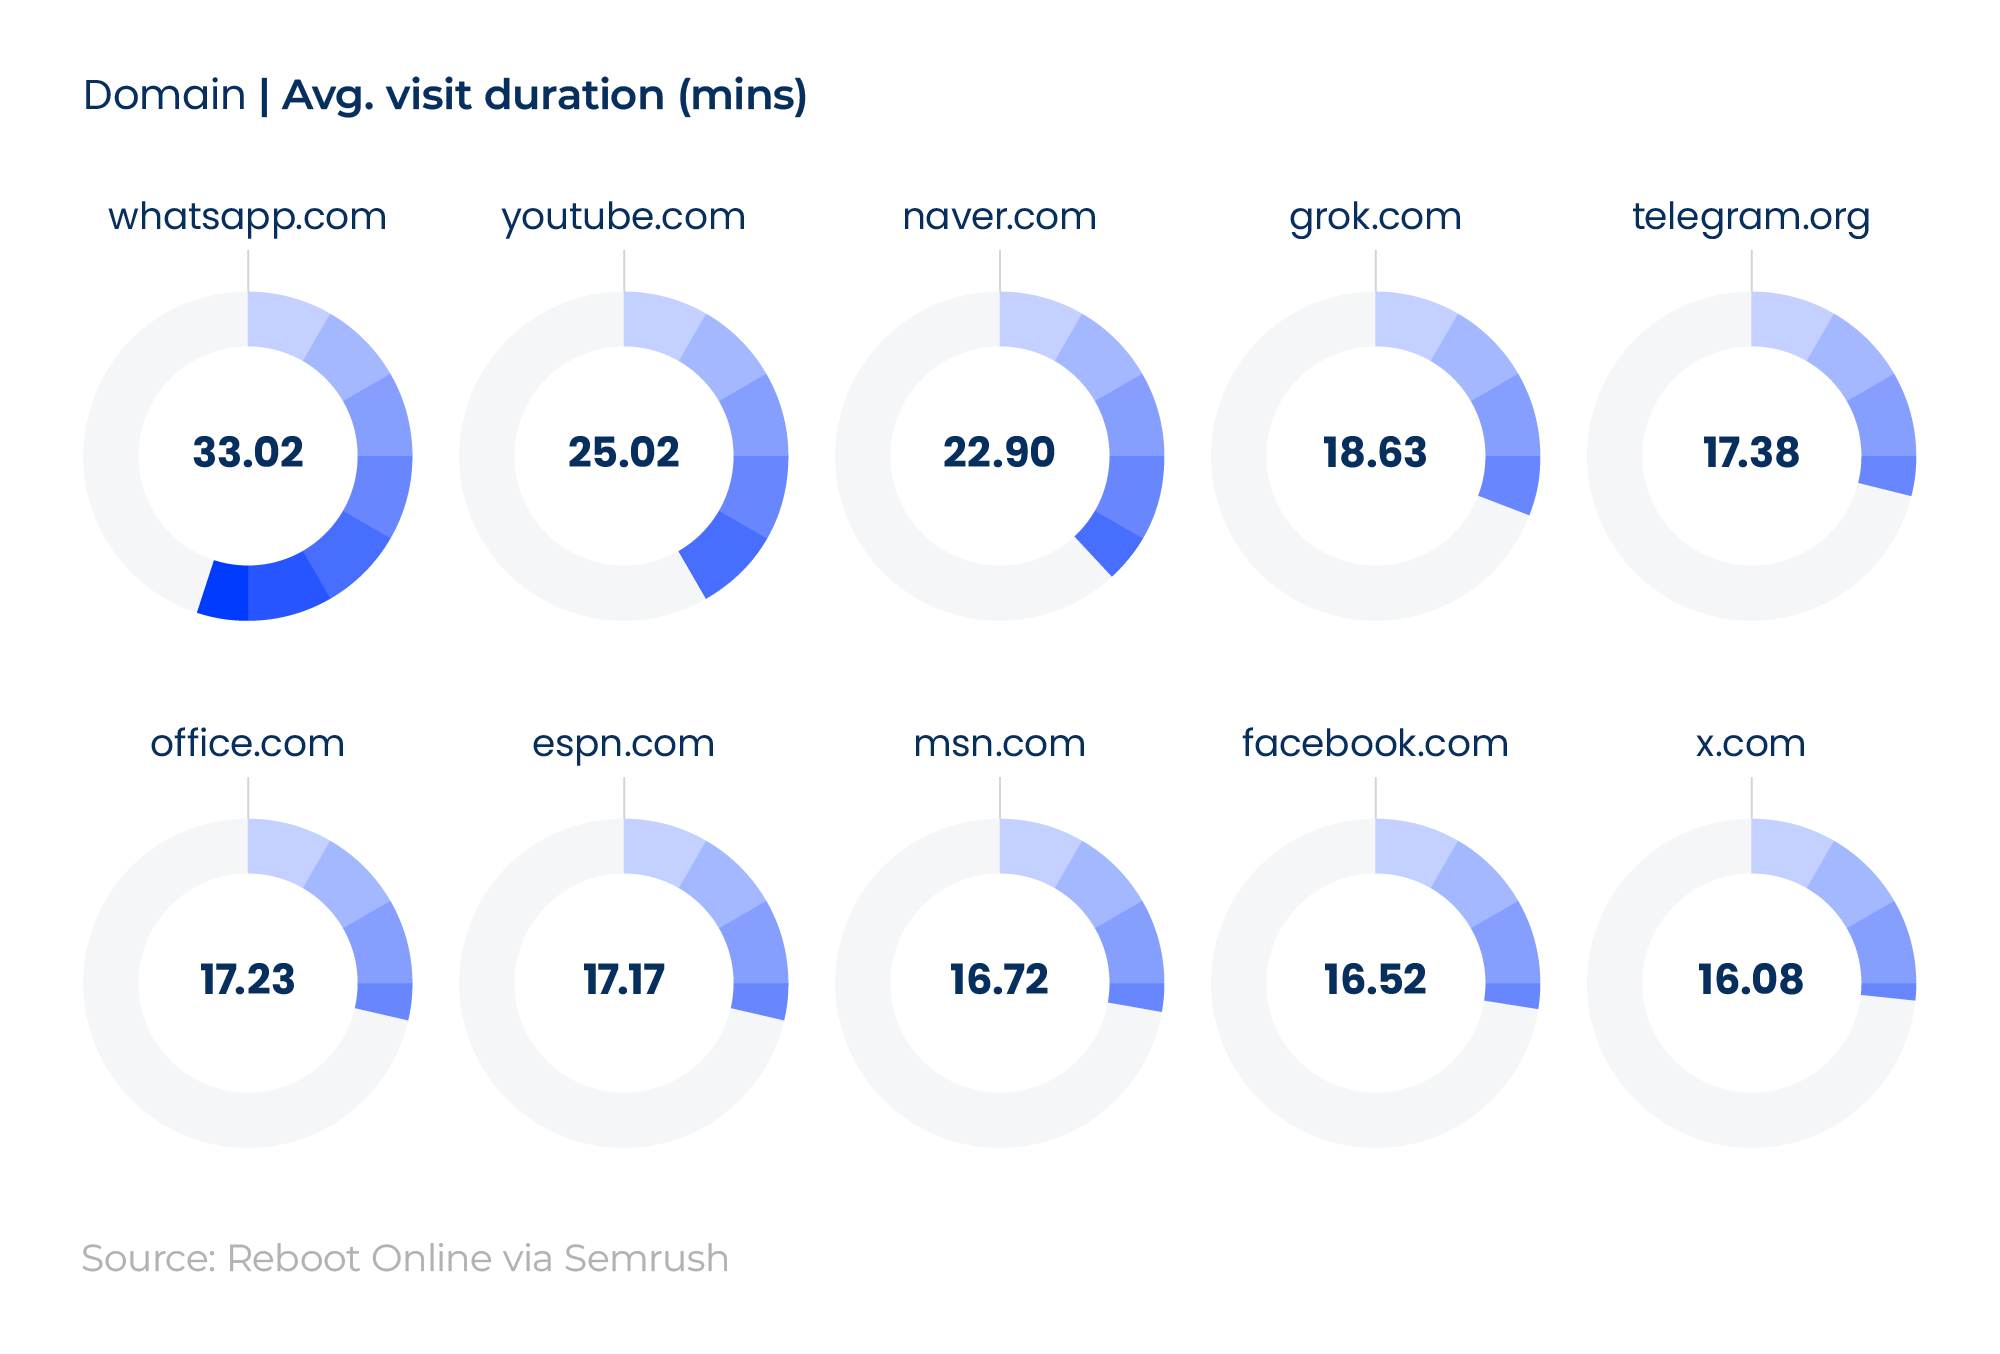
Global internet users spent longer on whatsapp.com than any other of the world’s 100 most visited websites in 2026, with a typical visit duration of just over 33 minutes.
This was about eight minutes longer than the typical YouTube user and more than 10 minutes longer than the average naver.com visitor.
In total, the average person spent around twice as long on WhatsApp in January 2026 as they did on X, Facebook, or MSN.
Shortest average time spent on a website in 2026
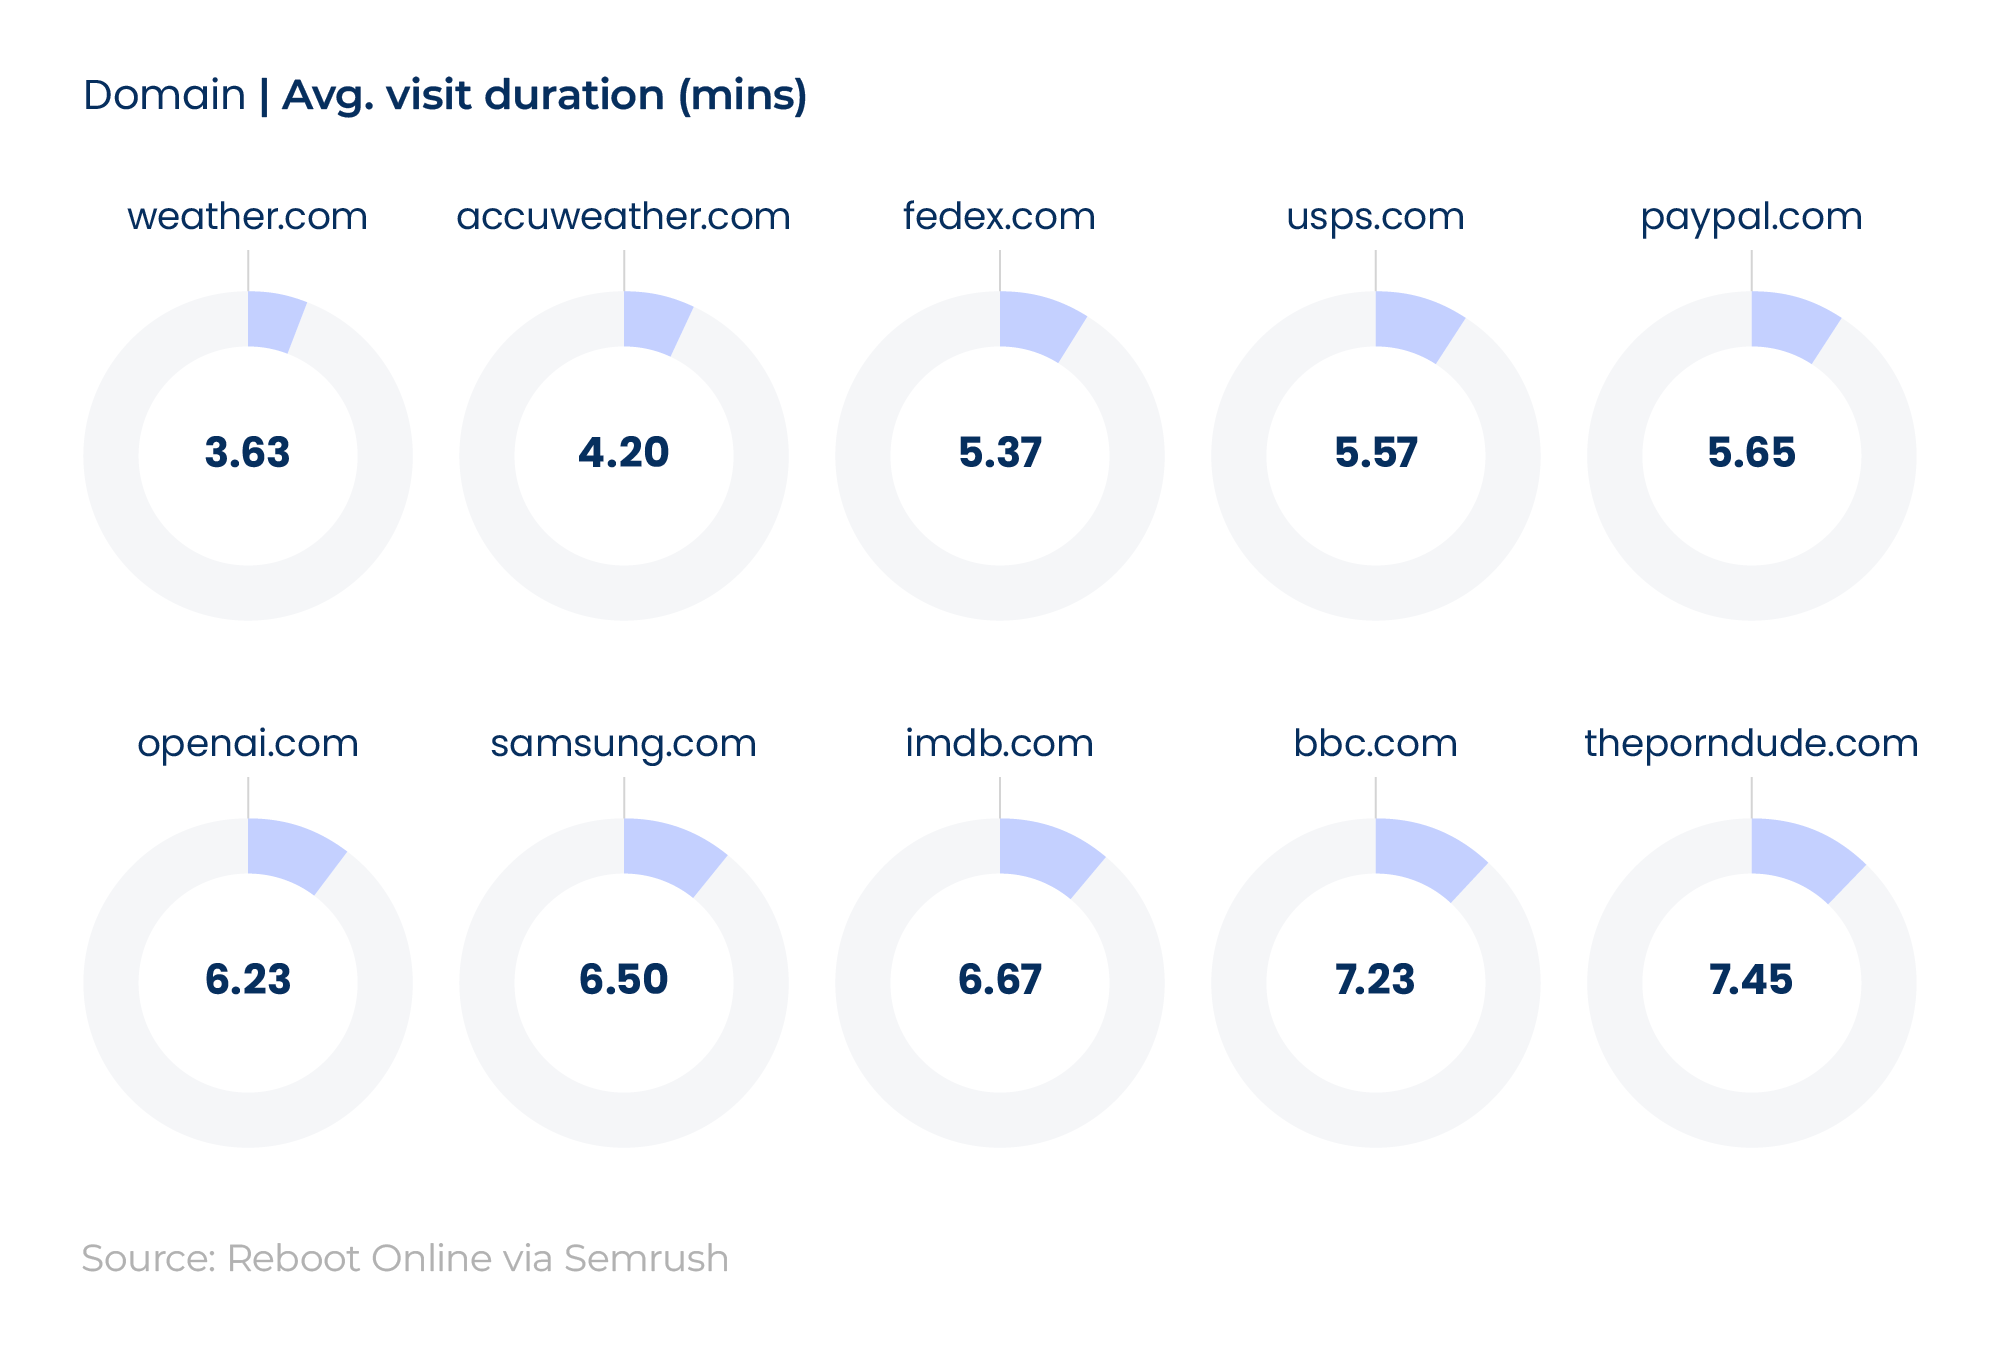
Our analysis of the shortest average time spent on the world’s 100 most visited websites reveals that the least amount of time was typically spent by those who visited weather.com.
In 2026, internet users typically spent almost 3 minutes and 40 seconds on the site. This was half a minute less than the typical visitor to accuweather.com, and approximately half the time spent by users of the BBC website in ninth.
Global average website bounce rate statistics
What is the average bounce rate of a website?
The average website bounce rate for the world’s top 10 most visited websites in 2026 was 45.28%.
Average bounce rate statistics for the world’s most visited websites of 2026
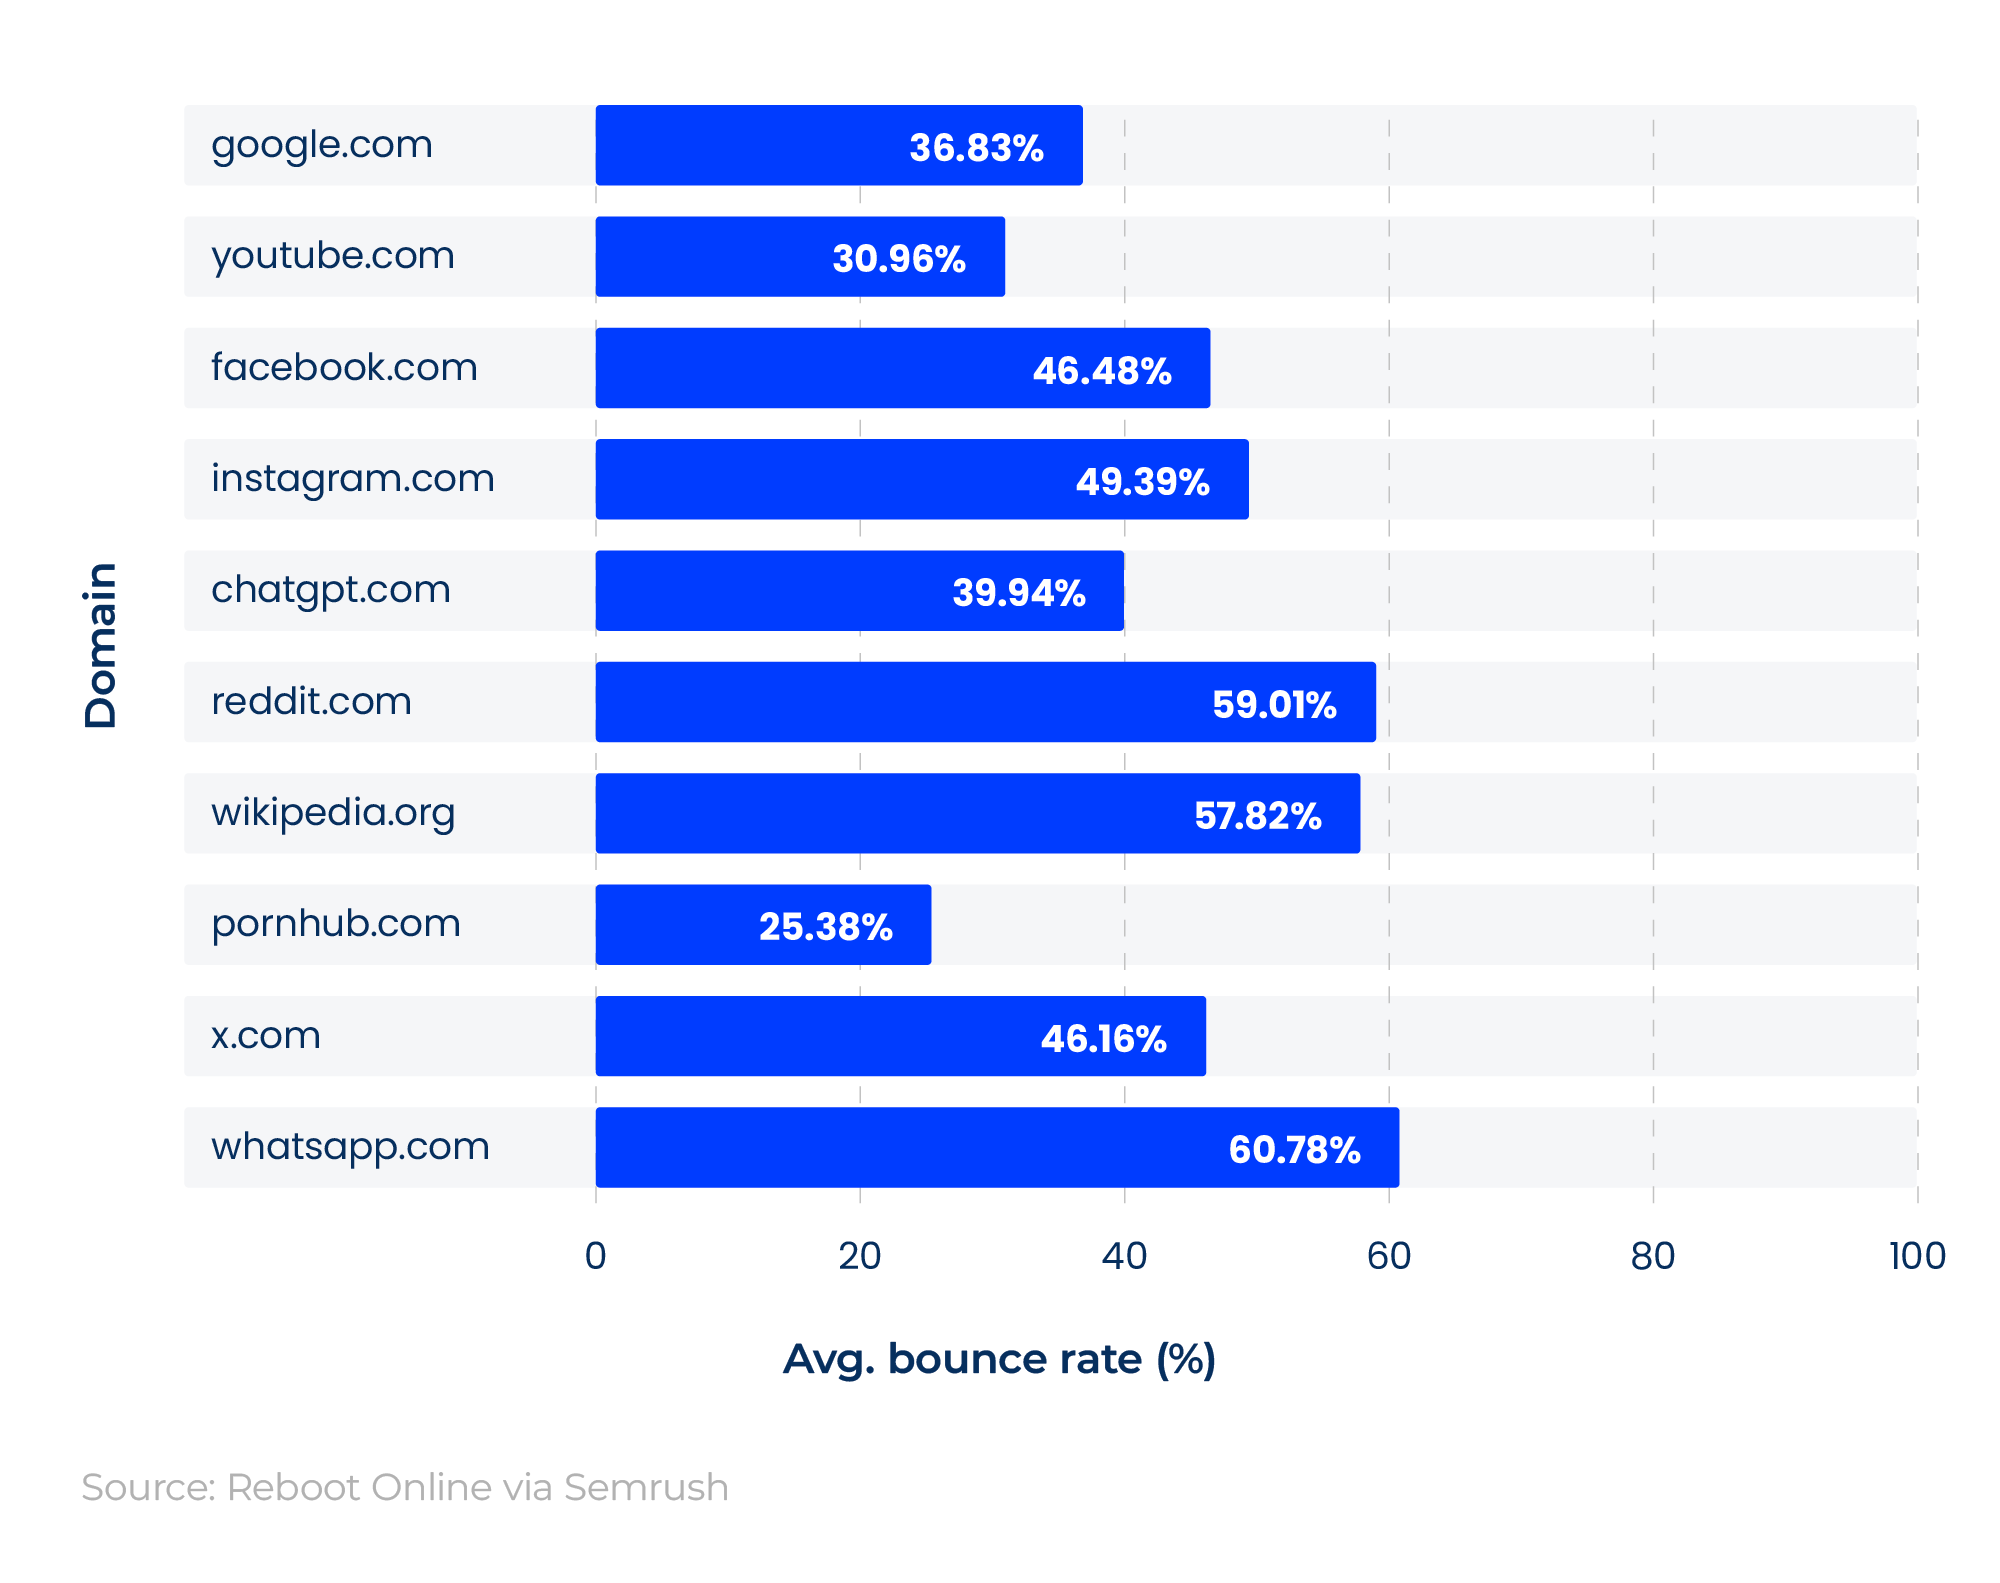
Among the world’s 10 most visited websites in January 2026, WhatsApp had the highest average bounce rate at 60.78%.
This was almost 2.5 times the average bounce rate for pornhub.com, the lowest on the list.
Highest average bounce rate statistics for the world’s most visited websites of 2026
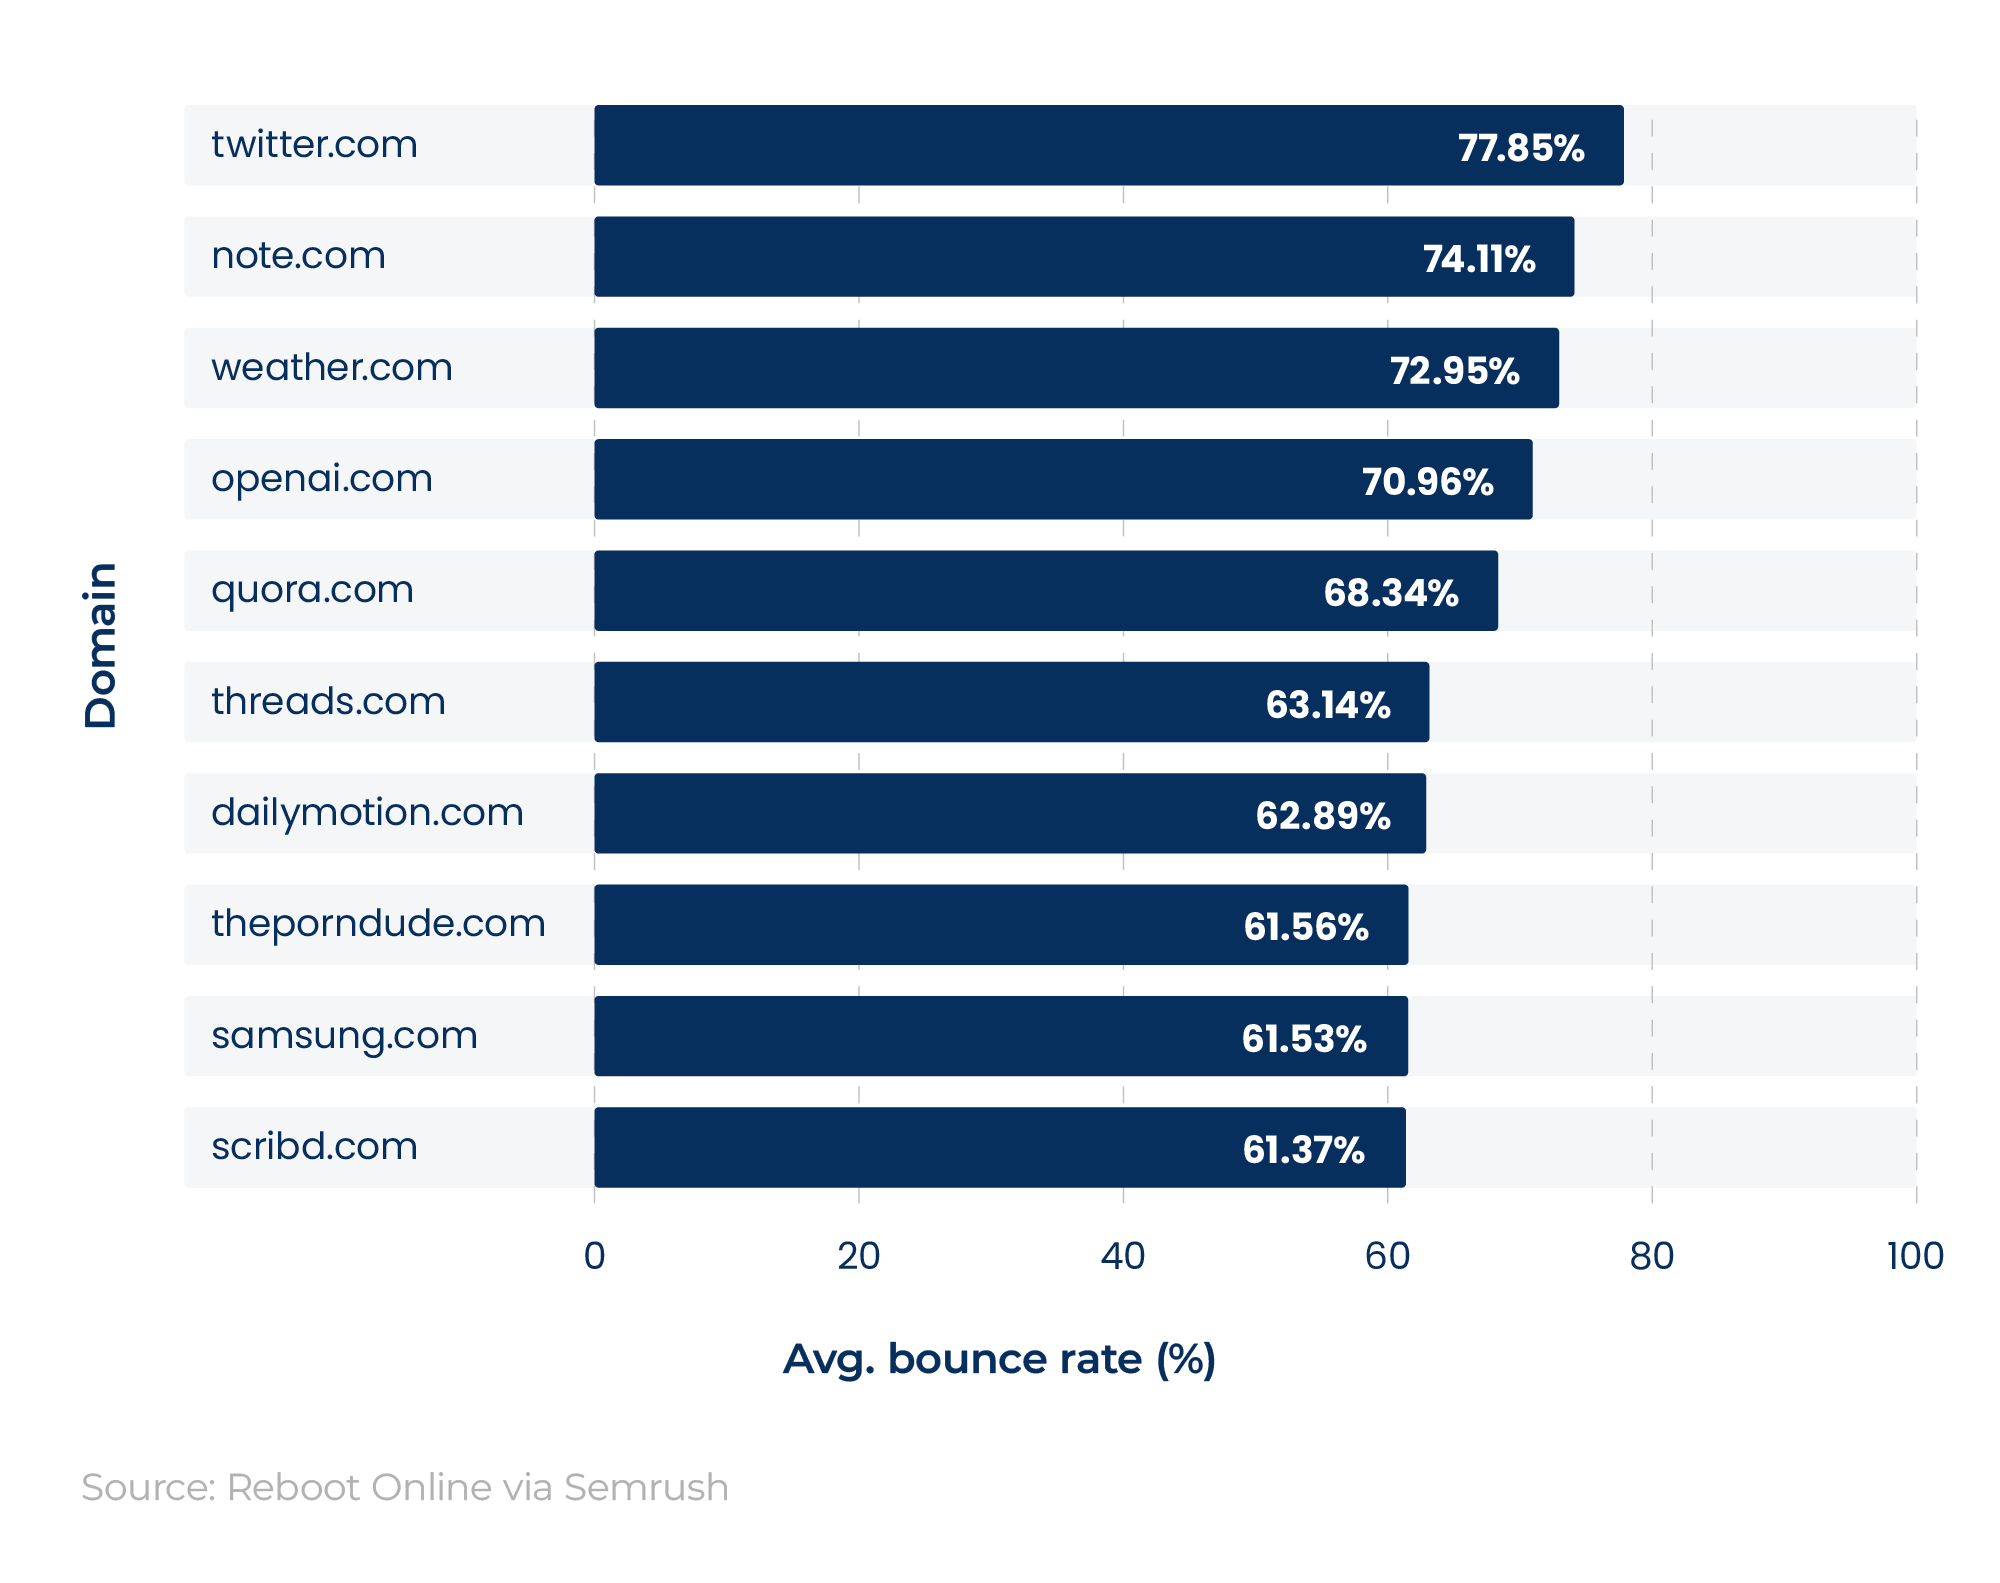
Of the 100 most visited websites in 2026, twitter.com had the highest average bounce rate at 77.85%. This was 3.74 percentage points higher than note.com, which ranked second.
Our website analysis shows that websites with higher bounce rates typically have a lower average number of pages per visit.
For example, global visitors to weather.com viewed 3.63 pages per visit in 2026 compared with 25.02 for YouTube. Yet YouTube’s bounce rate was 30.96% (more than half that of weather.com).
Lowest average bounce rate statistics for the world’s most visited websites of 2026
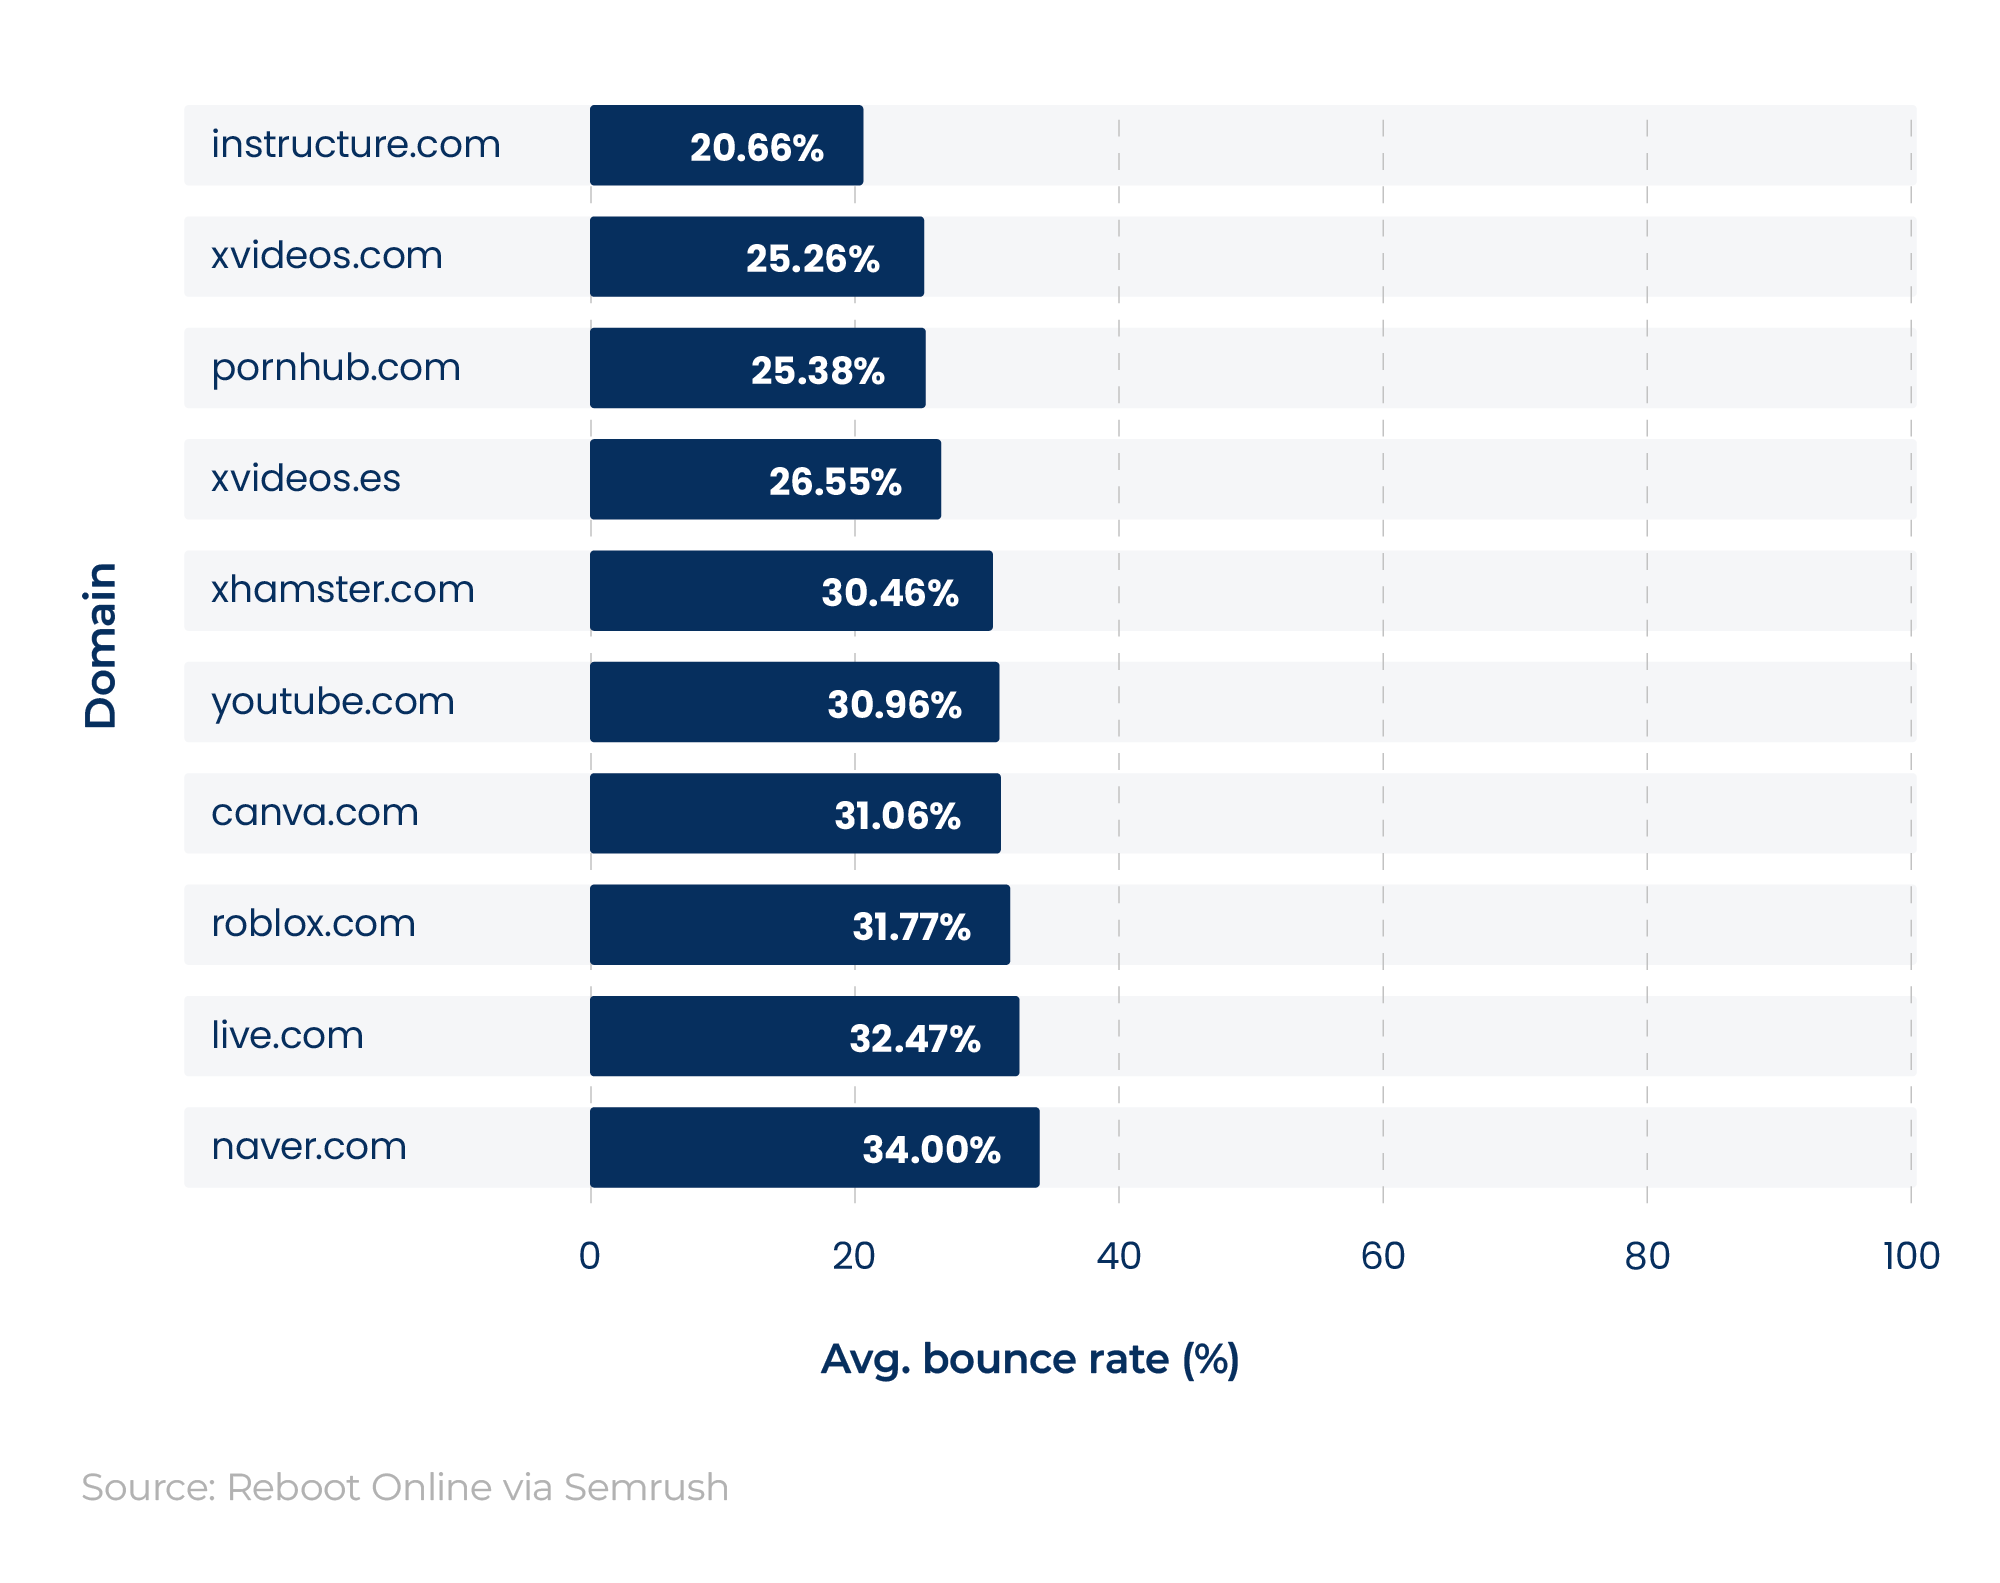
In terms of the lowest average bounce rate globally, instructure.com ranked first among the world’s 100 most visited websites in 2026.
At just 20.66%, this represented a bounce rate about five percentage points better than xvideos.com in second position (25.26%) and almost 15 percentage points lower than naver.com in tenth (34%).
This analysis supports the theory of an inverse relationship between bounce rate and the average number of pages per visit.
The three websites with the lowest bounce rate typically registered between 10 and 14 pages per visit in 2026, compared with those with the highest bounce rate, which typically generate fewer than 10 pages per visit.
Average page load time statistics
Ensuring your website is designed with page speed optimisation in mind is just one way to outrank your competitors in the SERP.
Website load speed statistics suggest that just a 1-second delay in a website’s loading speed could reduce the number of page views by as much as 11% and customer satisfaction by up to 16%. Research also reveals that almost half (47%) of people give up on a website that takes more than two seconds to load.
With that in mind, we analysed website load speed statistics for the 100 most visited websites of 2026 to see which had the fastest load times and how they compared.
What is the average load time for a website?
The average load time for the top 100 most visited websites in 2026 was 8.28 seconds, according to our analysis.
Average website load speed statistics for the world’s most visited websites (2026)
| Domain | First contentful paint (s) | Server response time (s) | Largest contentful paint (s) | Network server latency (s) | Speed index (s) | Speed index score |
|---|---|---|---|---|---|---|
| google.com | 0.91 | 0.00 | 1.08 | 0.01 | 1.20 | 1.000 |
| youtube.com | 6.21 | 0.10 | 8.74 | 0.15 | 6.21 | 0.886 |
| facebook.com | 2.95 | 0.13 | 3.25 | 0.00 | 2.95 | 0.960 |
| instagram.com | 1.53 | 0.23 | 31.55 | 0.03 | 7.15 | 0.864 |
| chatgpt.com | 2.73 | 0.05 | 19.32 | 0.00 | 9.14 | 0.819 |
| reddit.com | 3.01 | 0.14 | 4.80 | 0.01 | 4.30 | 0.929 |
| wikipedia.org | 0.92 | 0.04 | 1.52 | 0.00 | 2.39 | 0.973 |
| pornhub.com | 2.69 | 0.08 | 8.00 | 0.24 | 6.13 | 0.887 |
| x.com | 1.94 | 0.08 | 26.24 | 0.08 | 12.68 | 0.738 |
| whatsapp.com | 2.76 | 0.17 | 3.35 | 0.04 | 4.12 | 0.933 |
Source: Reboot Online via Google Lighthouse API
The speed index score is generated by the Google Lighthouse API using several variables, including:
- First contentful paint - the time at which the first text or image is painted.
- Server response time - the time it takes between a client requesting a page in a browser and a server responding to that request.
- Largest contentful paint - the time at which the largest text or image is painted .
- Network server latency - the time it takes for data to transfer across the network (i.e., the relative delay in communication).
- Speed index value - how quickly the contents of a page are visibly populated.
Of the top 10 most visited websites of 2026, few could compete with Google for first place, with a typical loading speed of 1.2 seconds. This was more than twice as fast as Facebook (third with 2.95 seconds) and Wikipedia (seventh with 2.39 seconds).
Fastest average website load speed statistics for the world’s most visited websites (2026)
| Domain | First contentful paint (s) | Server response time (s) | Largest contentful paint (s) | Network server latency (s) | Speed index (s) | Speed index score |
|---|---|---|---|---|---|---|
| google.com | 0.91 | 0.00 | 1.08 | 0.01 | 1.20 | 1.000 |
| deepseek.com | 0.93 | 0.01 | 3.48 | 0.04 | 1.36 | 0.996 |
| imdb.com | 1.57 | 0.00 | 1.57 | 0.00 | 1.57 | 0.992 |
| fedex.com | 0.76 | 0.00 | 1.05 | 0.00 | 2.32 | 0.974 |
| wikipedia.org | 0.92 | 0.04 | 1.52 | 0.00 | 2.39 | 0.973 |
| xvideos.es | 2.70 | 0.02 | 3.75 | 0.03 | 2.70 | 0.966 |
| xnxx.com | 2.79 | 0.01 | 6.74 | 0.03 | 2.79 | 0.964 |
| facebook.com | 2.95 | 0.13 | 3.25 | 0.00 | 2.95 | 0.960 |
| yandex.com | 3.09 | 0.06 | 5.64 | 0.00 | 3.09 | 0.957 |
| adobe.com | 1.35 | 0.00 | 2.12 | 0.00 | 3.20 | 0.954 |
Source: Reboot Online via Google Lighthouse API
According to our analysis, Google had the highest speed index score among the 100 most visited websites in 2026, with a score of 1. This was narrowly ahead of DeepSeek, which was second with 0.996, and IMDB, which was third with 0.992.
The average load speed of the top 10 fastest websites was 2.36 seconds, with adobe.com having the slowest average load speed of 3.2 seconds.
Google’s average load speed of 1.2 seconds was almost twice as fast as Wikipedia and just under two-thirds faster than Adobe in tenth position.
Slowest average website load speed statistics for the world’s most visited websites (2026)
| Domain | First contentful paint (s) | Server response time (s) | Largest contentful paint (s) | Network server latency (s) | Speed index (s) | Speed index score |
|---|---|---|---|---|---|---|
| patreon.com | 45.01 | 0.01 | 62.12 | 0.04 | 45.01 | 0.000 |
| grok.com | 4.11 | 0.17 | 23.74 | 0.01 | 21.85 | 0.529 |
| rakuten.co.jp | 1.95 | 0.01 | 15.33 | 0.12 | 17.74 | 0.623 |
| globo.com | 3.00 | 0.63 | 12.31 | 0.30 | 16.91 | 0.641 |
| spotify.com | 15.20 | 0.00 | 24.29 | 0.01 | 16.90 | 0.642 |
| uol.com.br | 4.55 | 6.06 | 6.00 | 3.03 | 16.69 | 0.646 |
| nytimes.com | 11.19 | 0.03 | 34.54 | 0.06 | 16.29 | 0.655 |
| foxnews.com | 5.61 | 0.02 | 15.18 | 0.02 | 15.46 | 0.674 |
| cnn.com | 9.51 | 0.15 | 17.28 | 0.04 | 15.13 | 0.682 |
| shein.com | 3.63 | 0.36 | 4.41 | 0.02 | 14.93 | 0.687 |
Source: Reboot Online via Google Lighthouse API
According to our research, the slowest website of 2026 was patreon.com, with an average load speed of 45.01 seconds. This made it the only website from the 100 most visited of 2026 to achieve a score of 0 on the speed index. For online stores, that is a useful reminder that a retail SEO agency should treat site speed as a commercial issue, not just a technical one.
Patreon’s average load speed was more than double that of Grok in second place, with 21.85 seconds and around two-thirds slower than Shein in tenth position.
Overall, when comparing the fastest and slowest websites of 2026, Google’s average load speed was more than 37.5 times faster than Patreon’s.
Global web design statistics
According to Cognitive Market Research, the global web design industry was valued at just under £56.82 billion as of 2024.
With a forecast CAGR of 8.5% between 2024 and 2031, the global web design industry could be worth £100.57 billion by 2031.
Website first impression statistics
According to a study by Lindgaard et al., it typically takes a web user 0.5 seconds to form an opinion of a website.
This is supported by a study on ResearchGate that found that 94% of first impressions were based solely on the website's appearance.

Another factor that can affect people’s first impressions of a website is the level of web accessibility.
A 2025 analysis by WebAIM of one million websites found:
- 50,960,288 errors - an average of 51 errors per page.
- 4.1% of all homepage elements had a detected accessibility error, meaning users with disabilities could expect to encounter an error in one in every 24 homepage elements they engaged with.
- 94.8% of homepages had WCAG 2.0 failures detected.
Most common types of WCAG failures (2025)
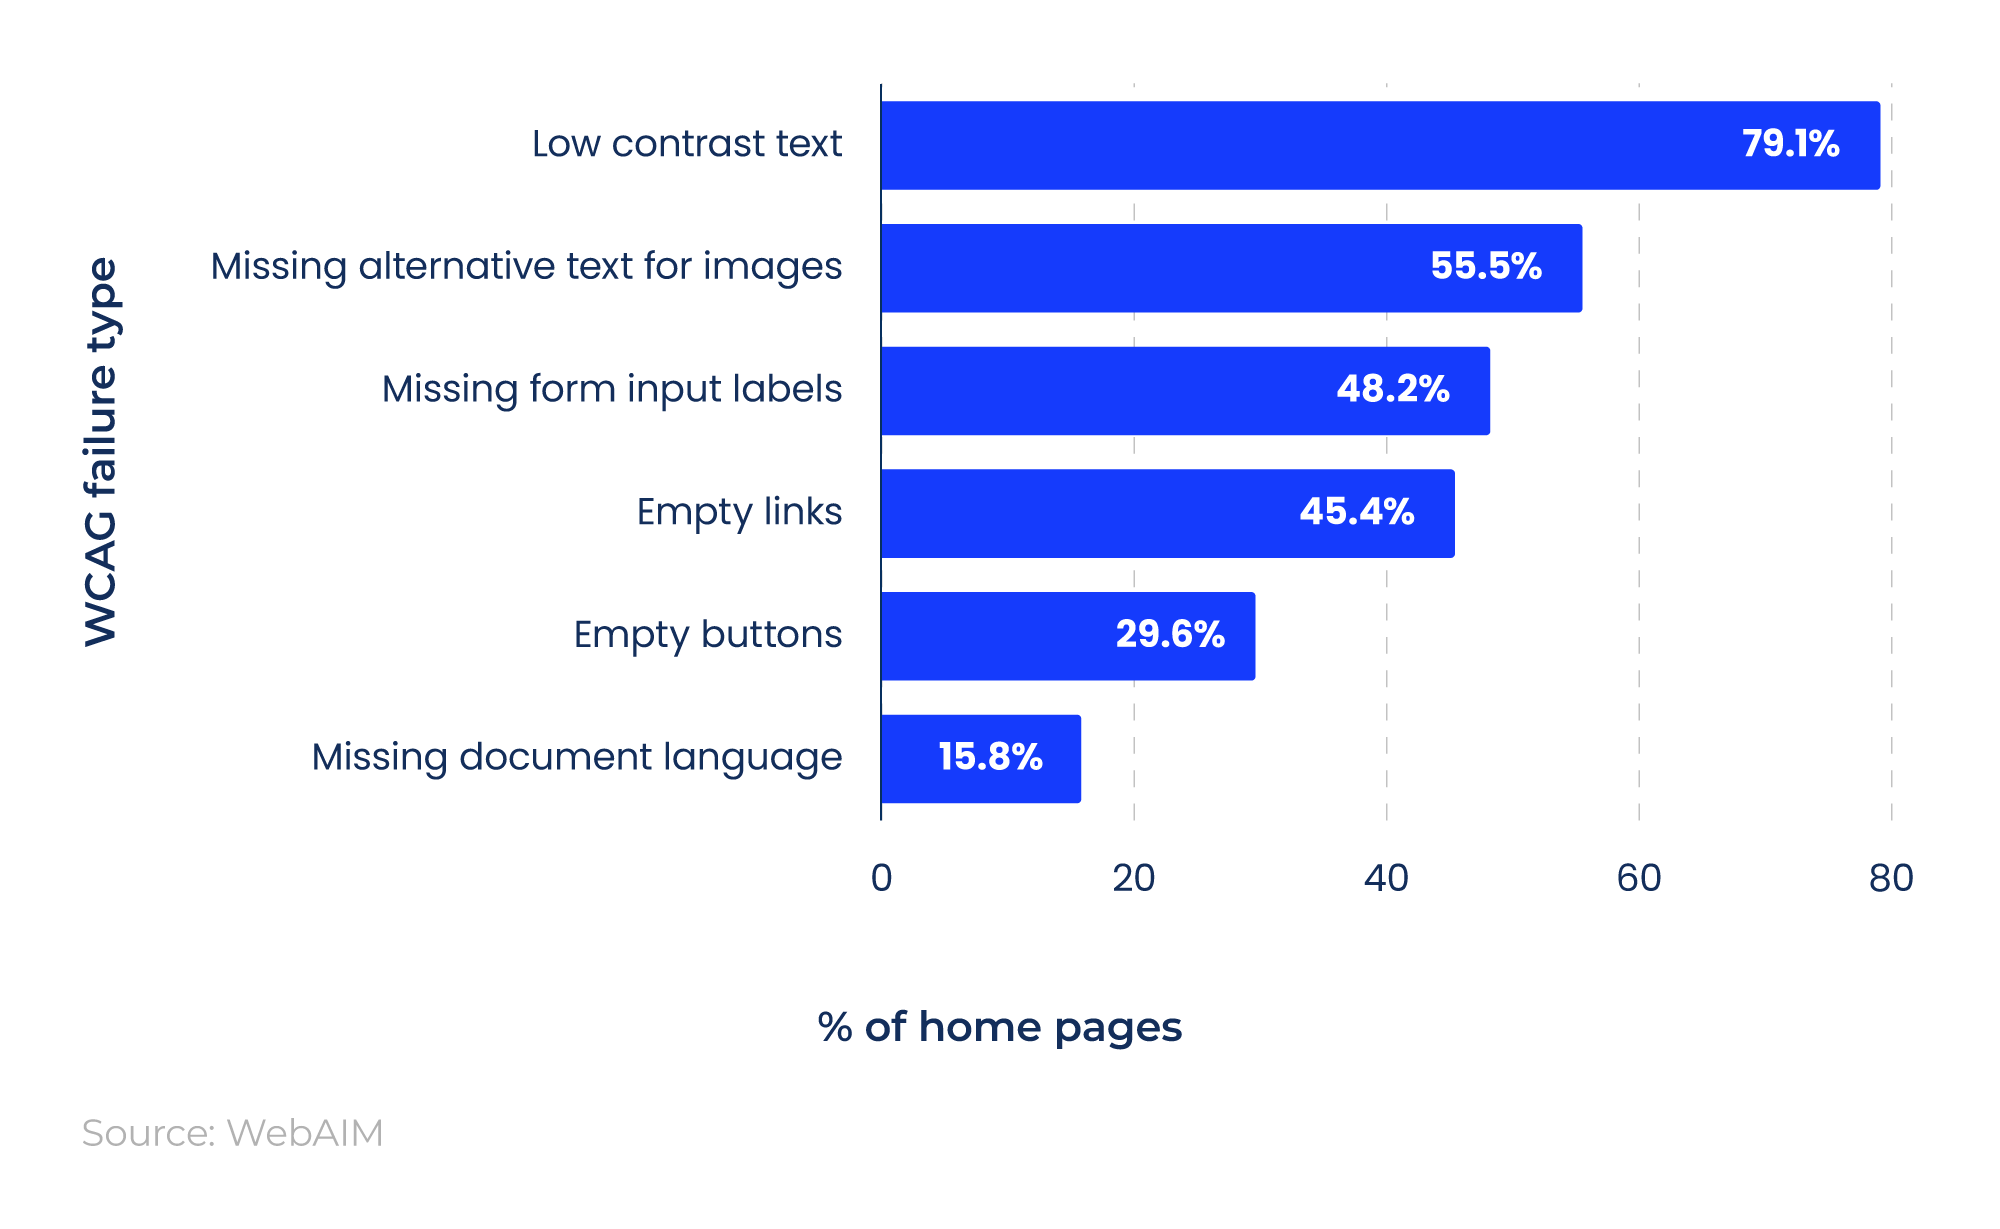
The most common type of WCAG failure detected on websites in 2025 was low-contrast text. This was the case for nearly four-fifths of the one million websites analysed, although the figure represents a 5.69% drop from 2023.
Further analysis shows that:
- The percentage of websites with WCAG errors has decreased since 2019.
- Between 2024 and 2025, the proportion of websites with these errors fell by 1.15 percentage points, from 95.9% to 94.8%.
- 55.5% of all websites analysed in 2025 lack accessibility features for those with visual impairments.
Missing document language was the least common WCAG-detected error across websites in 2025, with fewer than one in six reporting this failure. This marked a 17.72% reduction compared to 2023.
Did you know?
According to our SEO statistics report, only one in 20 webpages include one or more backlinks.
When designing your website, including backlinks is a vital step to drive growth, as these act as a vote of confidence, signalling the quality and authority of your content.
Responsive web design statistics
Web design statistics reveal that a responsive website design is not just about a web page's aesthetics and visual appeal.
A survey by Storyblok suggests that 60% don’t return to a website if the page is unresponsive.
With an average attention span of just eight seconds per internet user, web designers must create sites that respond quickly while remaining visually appealing and engaging.

This is supported by a study from Stayntouch, which found that 40% of consumers won’t wait more than three seconds for a page to load on a mobile before returning to the SERP.
Website cost statistics
What is the average cost of a website?
According to an analysis of the latest website cost statistics for 2026, the median cost is £17.10 per month, while the mean is £79.15 per month.
Website cost statistics across different companies and packages
| CMS Platforms | Package 1 (price per month) | Package 2 (price per month) | Package 3 (price per month) | Package 4 (price per month) |
|---|---|---|---|---|
| Wix | £9 | £16 | £25 | £119 |
| WordPress | £3 | £7 | £20 | £36 |
| Squarespace | £12 | £17 | £29 | £79 |
| Jimdo | £18 | £22 | £45 | - |
| Webnode | £2.90 | £4.90 | £8.90 | £15.90 |
| Webflow | £0 | £10.40* | £17.20* | £29.10* |
| GoDaddy | £7.41 | - | - | - |
| Pixpa | £3.05 | £5.08 | £6.77 | £8.47 |
| Shopify | £19 | £49 | £259 | £1,800 |
| Weebly | £0 | £5 | £9 | £19 |
| Square Online | £0 | £29 | - | - |
| Bitrix24 | £36 | £74 | £149 | £299 |
Sources: Reboot Online via pricing lists from various company websites | *Values converted from USD$ to GBP£
To ascertain the average cost of building a website, we collated website pricing statistics from various web-building tools and companies available online across the packages they offered customers.
Our findings show that the cost of a website build can vary from £0 per month up to £1,800 per month.
This will depend on many factors, including the:
- Amount you have/wish to spend.
- Size of your company.
- Level of expertise you require and the number of web designers.
- Amount of autonomy you wish to retain over the website.
- Degree of involvement from external sources.
- Level of site analytics you require.
- Total online storage space you need.
- Site features and applications you wish to be built into the site.
Some web-building companies, such as Webflow, Weebly, and Square Online, allow you to use their services for free in a limited capacity. Yet others may charge for this service, ranging from £2.90 per month at Webnode to £36 per month at Bitrix.
Our analysis reveals that the most expensive website package available in 2026 is Shopify’s top-tier package, priced at £1,800 per month.
What is the average time to build a website?
In total, the average time to build a website is somewhere between 10 and 14 weeks and will include a series of steps to do this successfully, including:
- Planning (2-3 weeks)
- Content creation (4-6 weeks)
- Web design (2-3 weeks)
- Testing and review (1-2 weeks)
These timings are estimates and may vary depending on the complexity of your website and the features you desire in the final product.

The time to build a website can be affected by various factors, such as:
- Whether it’s a single scrolling page or a series of pages.
- If you’re doing it yourself, working with a single developer, or hiring a dedicated team.
- The purpose of the website (i.e. providing information vs selling products and services).
- Complexity of your sitemap and website’s layout.
- Type of content on your website (e.g. written, video, audio, data visualisations).
- Navigational tools to enhance the user experience (UX) - such as menus, ‘return to top’ features, and AI chatbots.
The average lifespan of a website is around two years and seven months, according to Orbitmedia.
It’s important to plan the website before it goes live to ensure the website is fit for purpose, meets the needs of your target audience, and is designed with longevity in mind.
Global CMS statistics
The use of content management systems (CMS) in website creation has risen dramatically since 2011, when 76% of all websites were coded by hand. By 2022, this figure had more than halved to 33%.
As of 2026, it’s estimated that around 64% of all websites use a CMS to create web pages and manage online content.
Global CMS market revenue statistics
Revenue from the CMS market totalled $34.94 billion in 2025. With a CAGR of 10.6% between 2026 and 2033, the CMS industry could be worth $77.77 billion by 2033.
In global terms, more than a third (35.2%) of revenue share in 2025 came from the North American market.
The most common CMS systems in the world
As of February 2026, WordPress is the most widely used CMS, accounting for around 60.2% of the total CMS market. This made it almost nine times as popular as Shopify, the second most popular at 7%.
World’s most common CMS by market share (2026)
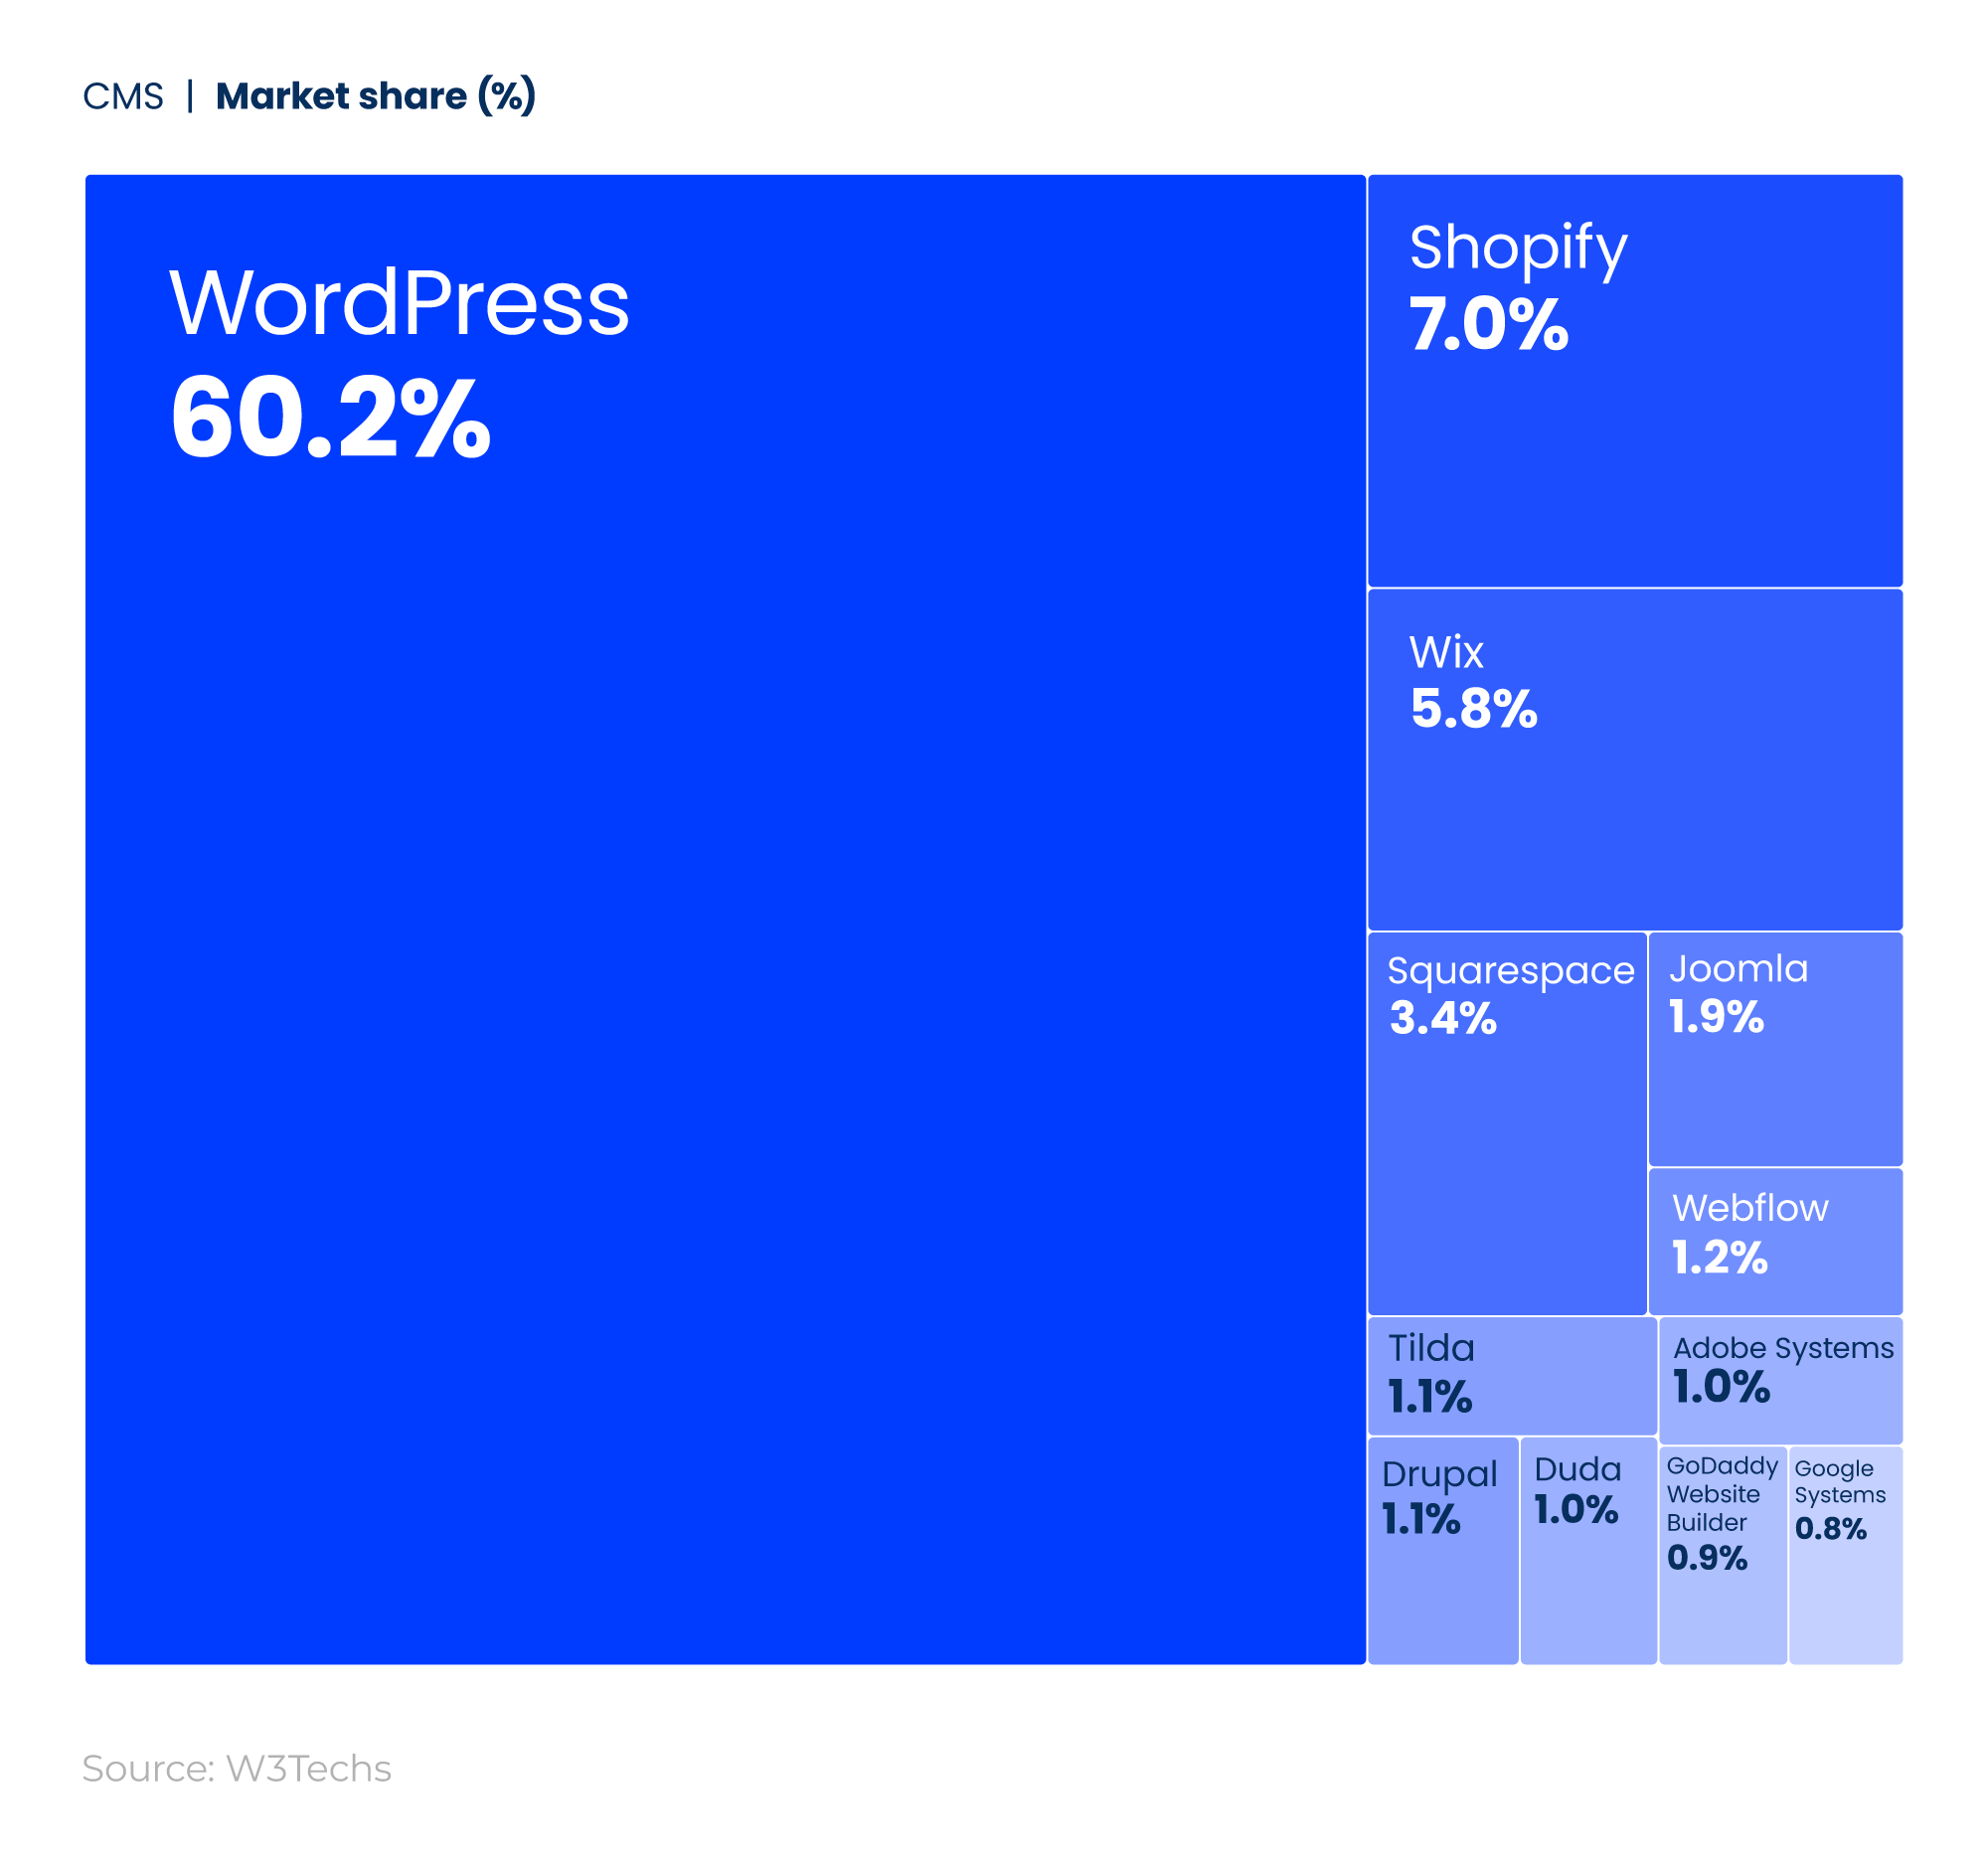
Wix follows next, accounting for roughly one-twentieth of the global CMS market.
Using WordPress for your website?
Even the world’s most popular CMS needs a strong search strategy to compete. Explore our WordPress SEO services to improve rankings, technical performance and long-term visibility.
Most common CMS in the world over time (2015 to 2026) by market share
WordPress has remained the dominant force in the global CMS market since 2015, fluctuating between 58.5% in 2017 and 65.2% in 2022.
In 2015, Shopify’s market share was just 0.7%. Yet by 2026, this had increased by a factor of 10, becoming the second-most popular CMS behind WordPress. A similar story is seen for Wix and Squarespace, with respective increases of 0.3% to 5.8% and 0.5% to 3.4% in the same period.
Joomla, on the other hand, experienced the opposite between 2015 and 2026, with its market share decreasing from 8.6% to 1.9%.
Forecasted most common CMS by market share (2027 to 2035)
| Year | WordPress | Shopify | Wix | Squarespace | Joomla | Webflow | Tilda | Duda | Drupal | GoDaddy Website Builder | Other |
|---|---|---|---|---|---|---|---|---|---|---|---|
| 2027 | 60.2% | 7.8% | 6.3% | 3.4% | 1.6% | 1.3% | 1.4% | 1.2% | 0.8% | 1.0% | 15.1% |
| 2028 | 60.1% | 8.3% | 6.8% | 3.5% | 1.3% | 1.4% | 1.7% | 1.3% | 0.5% | 1.0% | 14.1% |
| 2029 | 60.1% | 8.8% | 7.2% | 3.5% | 1.0% | 1.5% | 2.0% | 1.5% | 0.1% | 1.1% | 13.1% |
| 2030 | 60.0% | 9.2% | 7.7% | 3.6% | 0.8% | 1.6% | 2.3% | 1.7% | 0.0% | 1.1% | 12.0% |
| 2031 | 60.0% | 9.6% | 8.2% | 3.6% | 0.6% | 1.7% | 2.6% | 1.8% | 0.0% | 1.2% | 10.7% |
| 2032 | 60.0% | 10.0% | 8.7% | 3.7% | 0.4% | 1.8% | 2.8% | 2.0% | 0.0% | 1.3% | 9.5% |
| 2033 | 59.9% | 10.4% | 9.1% | 3.7% | 0.2% | 1.9% | 3.1% | 2.2% | 0.0% | 1.3% | 8.2% |
| 2034 | 59.9% | 10.7% | 9.6% | 3.7% | 0.0% | 2.0% | 3.4% | 2.3% | 0.0% | 1.4% | 7.0% |
| 2035 | 59.9% | 11.1% | 10.1% | 3.8% | 0.0% | 2.1% | 3.7% | 2.5% | 0.0% | 1.4% | 5.6% |
Source: Reboot Online via W3Techs
Using forecast analysis, WordPress should remain the most common CMS for the foreseeable future. Yet its global market share is expected to fall below 60% by 2033.
It’s estimated that Shopify could account for more than a tenth of the CMS market by 2032, rising to 11.1% by 2035. This would represent a 4.1 percentage-point increase over 10 years.
Conversely, based on current trends, the market share of Joomla and Drupal could both reach 0% by 2034.
CMS usage statistics (2026)
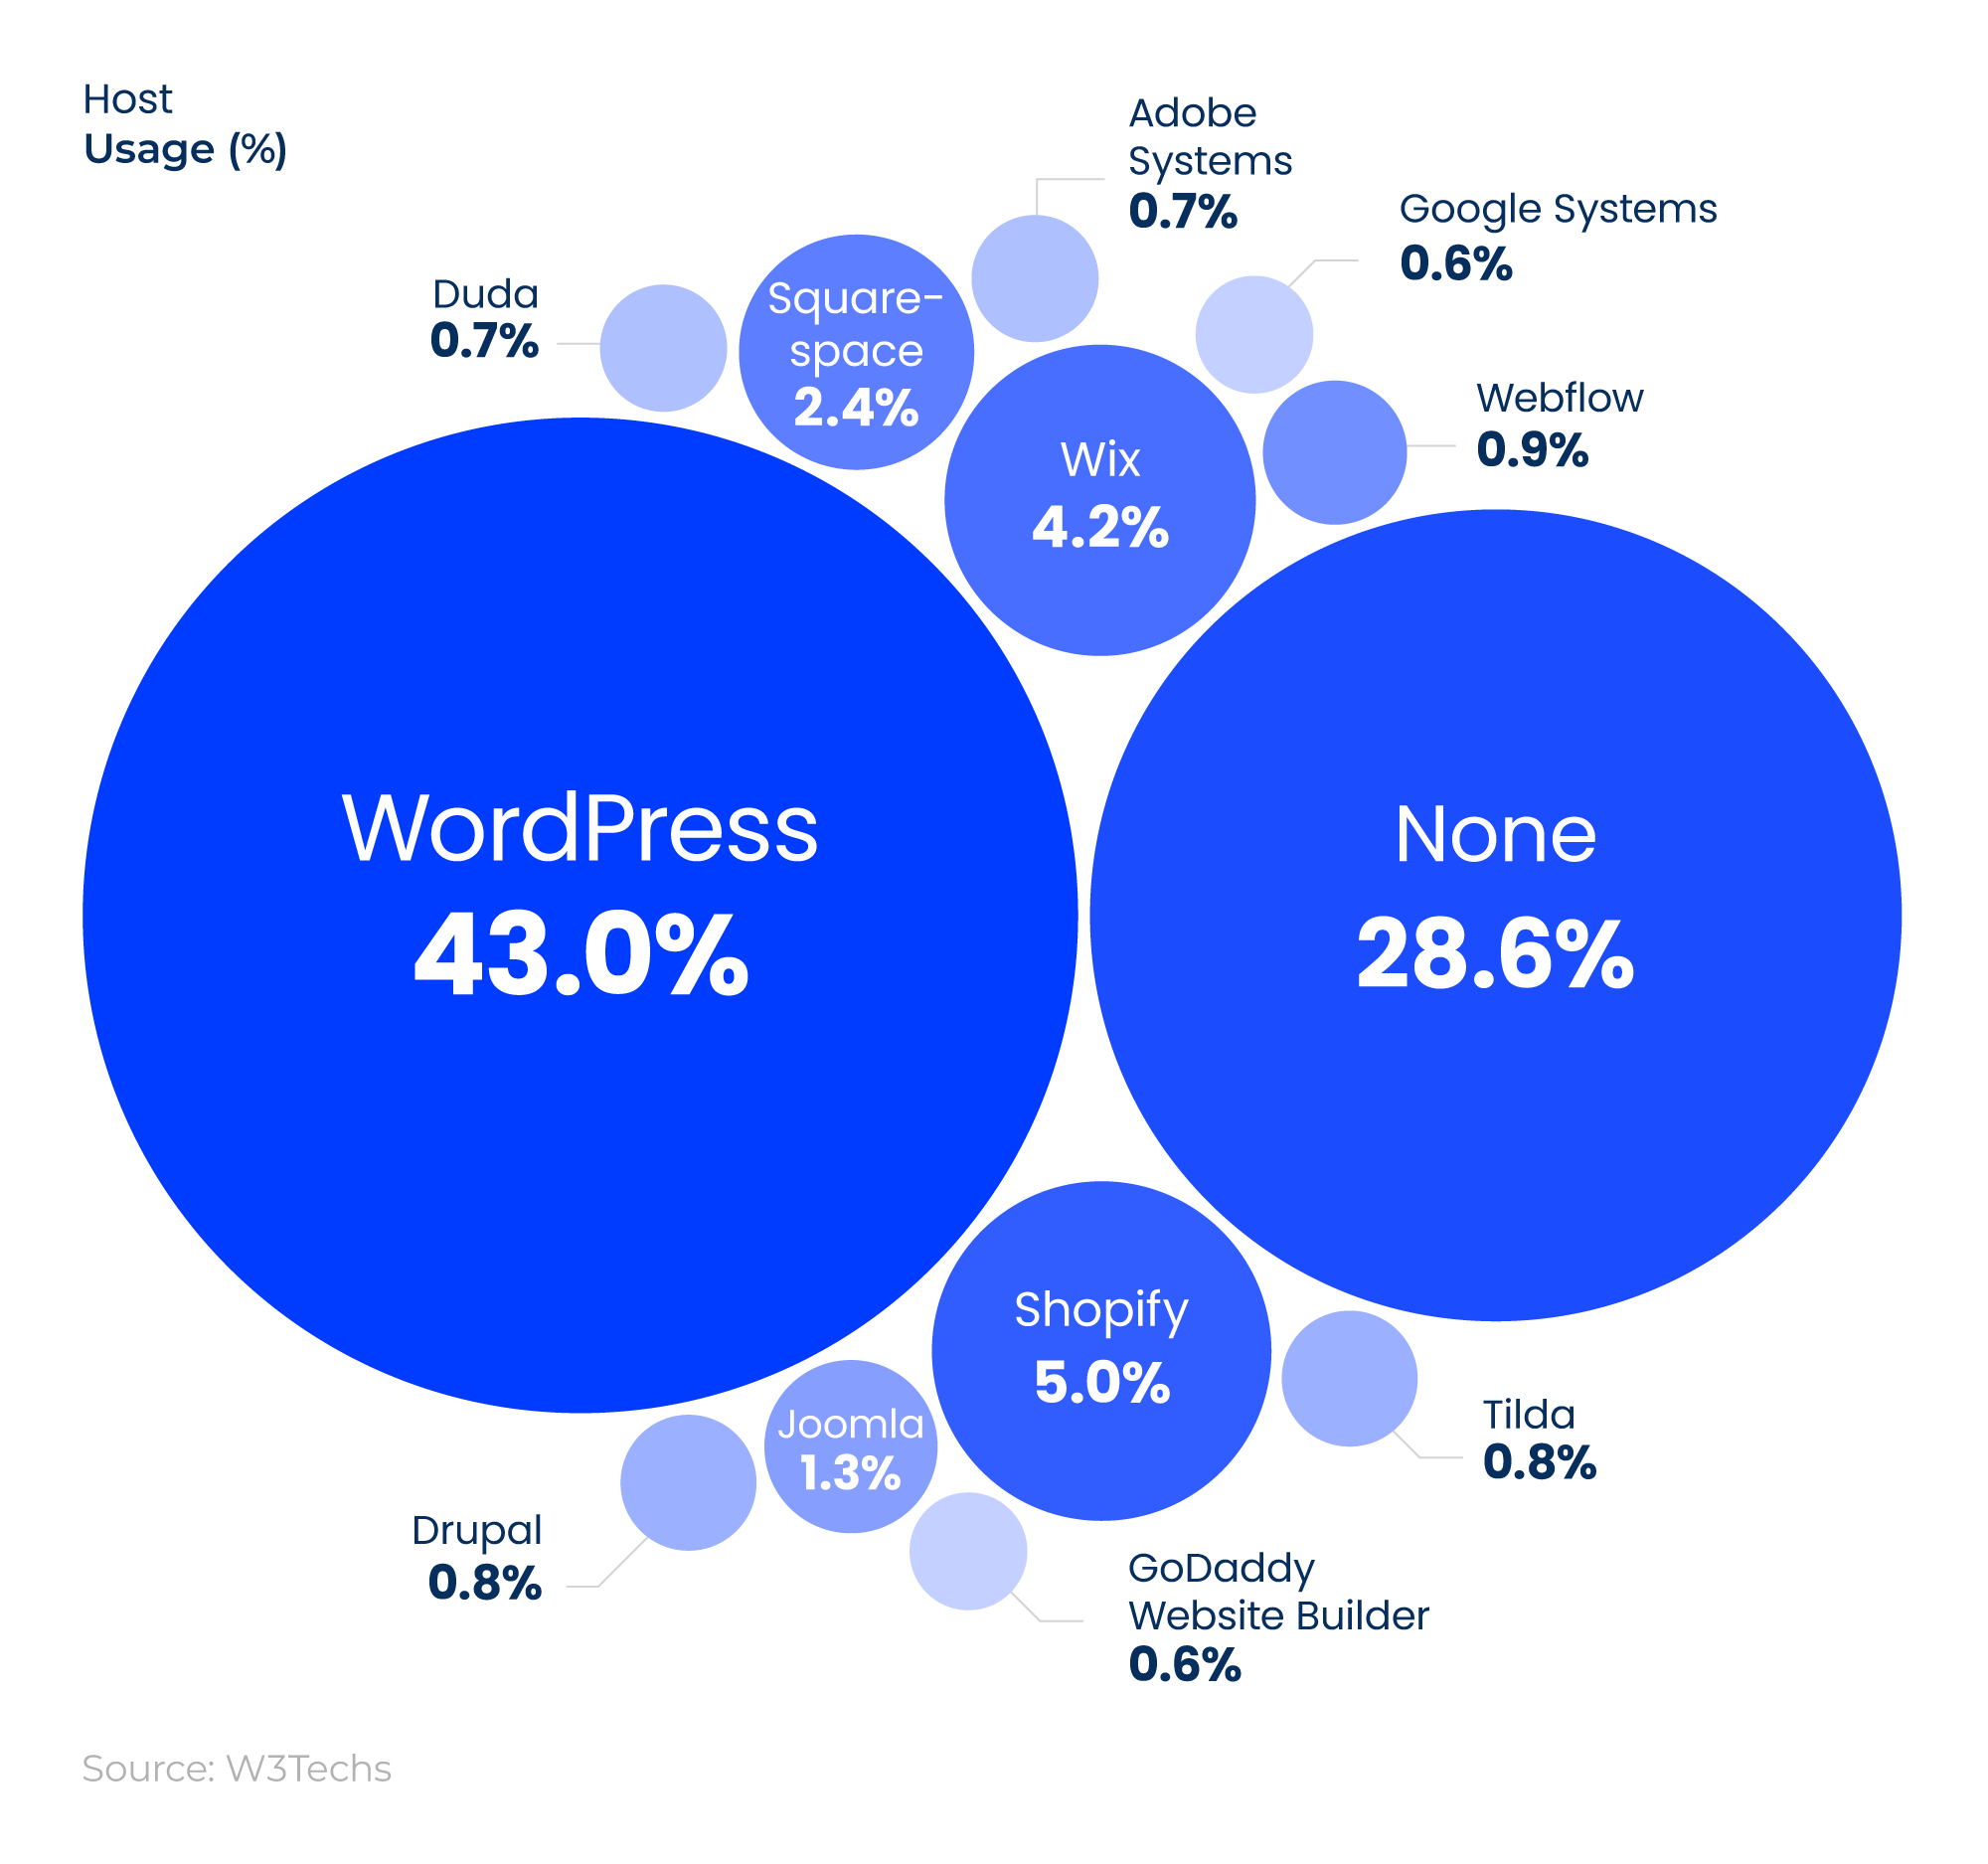
As of 2026, WordPress was the most widely used CMS worldwide, with just over two-fifths of websites using it. This makes WordPress around eight times more popular than Shopify in second place (5%) and around 10 times more common than Wix in third (4.2%).
Incidentally, more than a quarter of websites in 2026 don’t use a CMS.
CMS usage statistics over time (2015 to 2026)
As of 2026, 28.6% of websites don’t use a CMS — a figure that has more than halved since 2015, when the figure stood at 61.7%.
WordPress usage statistics indicate that during this time, its popularity has almost doubled, from 23.3% to 43%. Between 2015 and 2024, the proportion of Shopify users increased by more than 1,500%, from 0.3% to 5%.
A similar story is seen in the rising popularity of:
- Squarespace (1,100%)
- Wix (4,100%)
Conversely, CMS usage statistics for Joomla more than halved between 2015 and 2026, from 3.3% to 1.3%.
Forecasted CMS usage statistics over time (2027 to 2035)
| Year | None | WordPress | Shopify | Wix | Squarespace | Joomla | Other |
|---|---|---|---|---|---|---|---|
| 2027 | 26.7% | 42.6% | 5.7% | 4.9% | 2.5% | 1.1% | 16.6% |
| 2028 | 25.2% | 42.2% | 6.1% | 5.6% | 2.7% | 0.9% | 17.3% |
| 2029 | 23.8% | 42.0% | 6.6% | 6.3% | 2.8% | 0.7% | 17.9% |
| 2030 | 22.6% | 41.7% | 7.0% | 7.0% | 2.9% | 0.5% | 18.3% |
| 2031 | 21.4% | 41.6% | 7.4% | 7.7% | 3.0% | 0.3% | 18.6% |
| 2032 | 20.4% | 41.4% | 7.9% | 8.4% | 3.1% | 0.1% | 18.7% |
| 2033 | 19.5% | 41.3% | 8.3% | 9.0% | 3.2% | 0.0% | 18.7% |
| 2034 | 18.6% | 41.2% | 8.7% | 9.7% | 3.3% | 0.0% | 18.4% |
| 2035 | 17.8% | 41.1% | 9.2% | 10.4% | 3.3% | 0.0% | 18.1% |
Source: Reboot Online via W3Techs | Note: Figures may not equal 100% due to rounding.
Our forecast suggests that WordPress will continue to dominate the CMS landscape in 2035, accounting for just over two-fifths of all websites. This, however, represents a 1.9 percentage-point decrease from the 2026 figures.
The percentage of websites using Shopify is estimated to almost double over this period, with the corresponding figure for Joomla expected to reach 0% by 2033 (based on existing usage trends).
The proportion of websites not using a CMS is expected to almost halve between 2026 and 2035, dropping to 17.8%.
Business website statistics
B2B website statistics
According to Sagefrog’s 2025 Marketing Mix report, just 6% of marketing companies claim that website development is their top area of spending when it comes to budget allocation.
The majority of marketing professionals (54%) intend to allocate budget to marketing technology in the coming year, with more than a third also intending to spend big on direct marketing (36%) and content marketing (34%). For businesses prioritising content marketing, a designated B2B SEO agency can help ensure you maximise your brand's potential online.
Marketing spending statistics in terms of company priorities
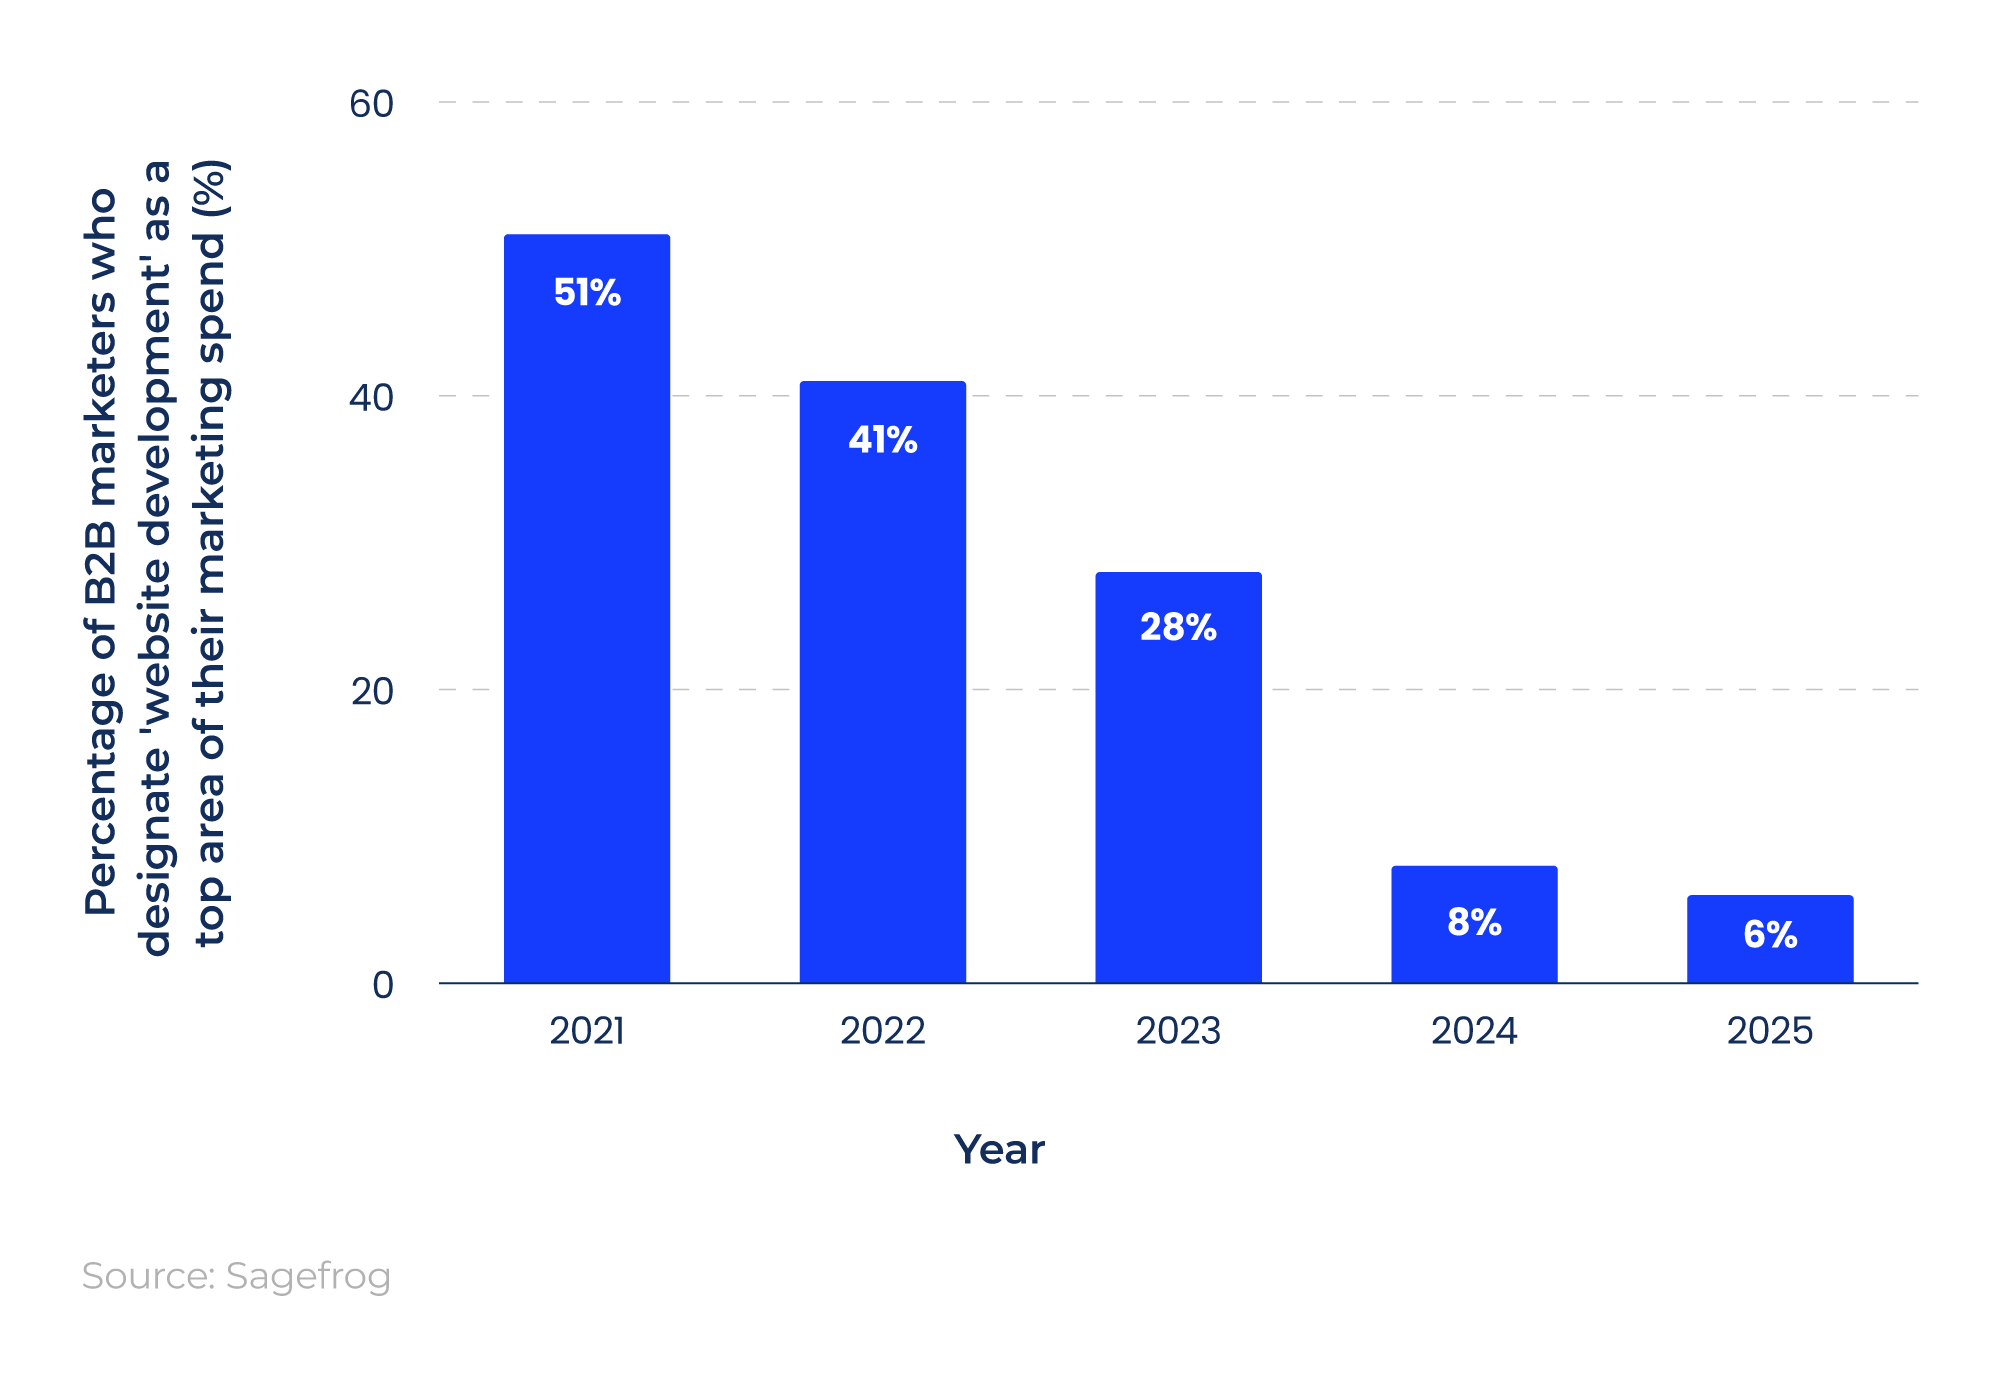
In previous years, website development was considered much more important by marketing professionals, with approximately half allocating it as a top budget item in 2021.
This figure has fallen year-on-year, from just over a quarter in 2023 to less than a tenth in 2024.
Marketing AI usage for website development
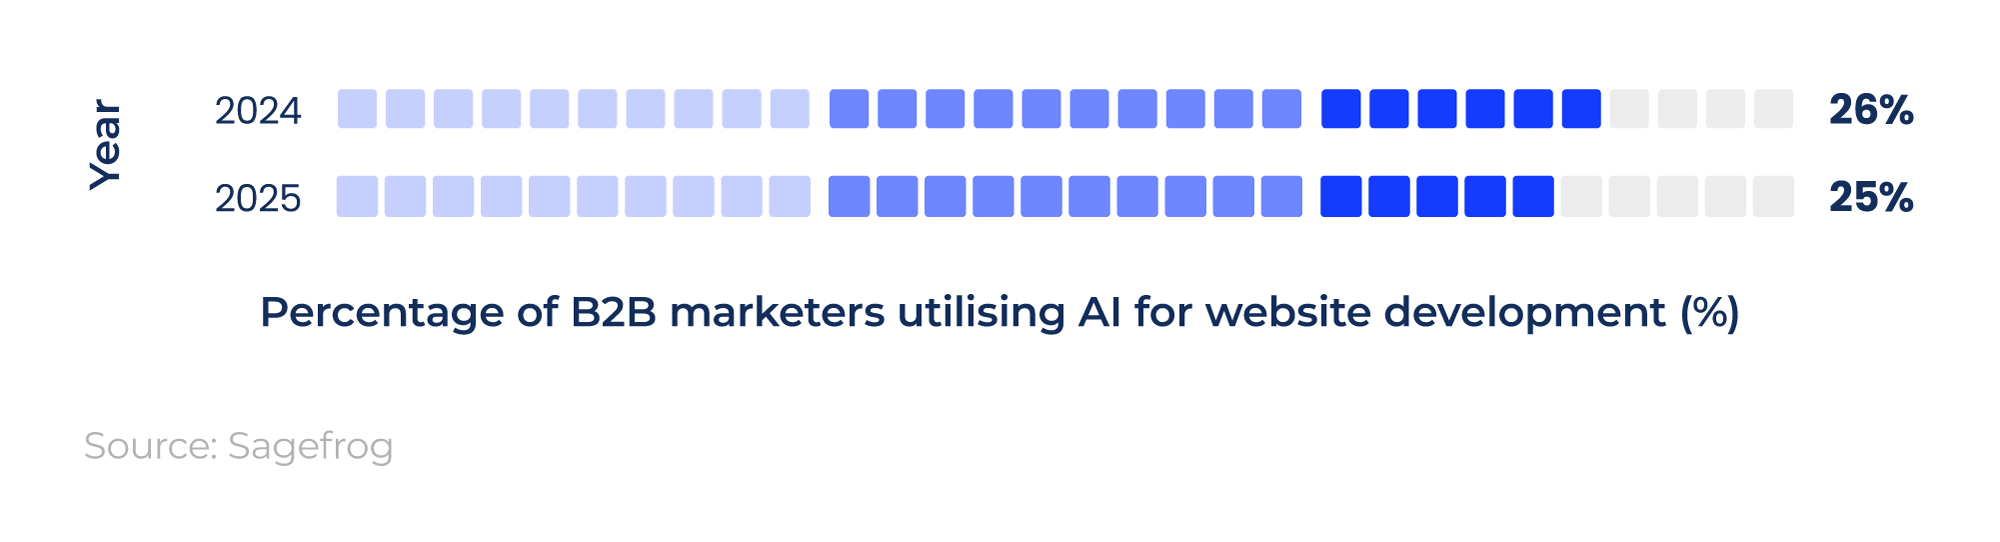
A new question posed to professionals in the Marketing Mix Report in recent years relates to how marketers intend to utilise AI.
In 2024 and 2025, around a quarter of professionals stated they would use AI technology for website development.
Small business website statistics and the importance of their website
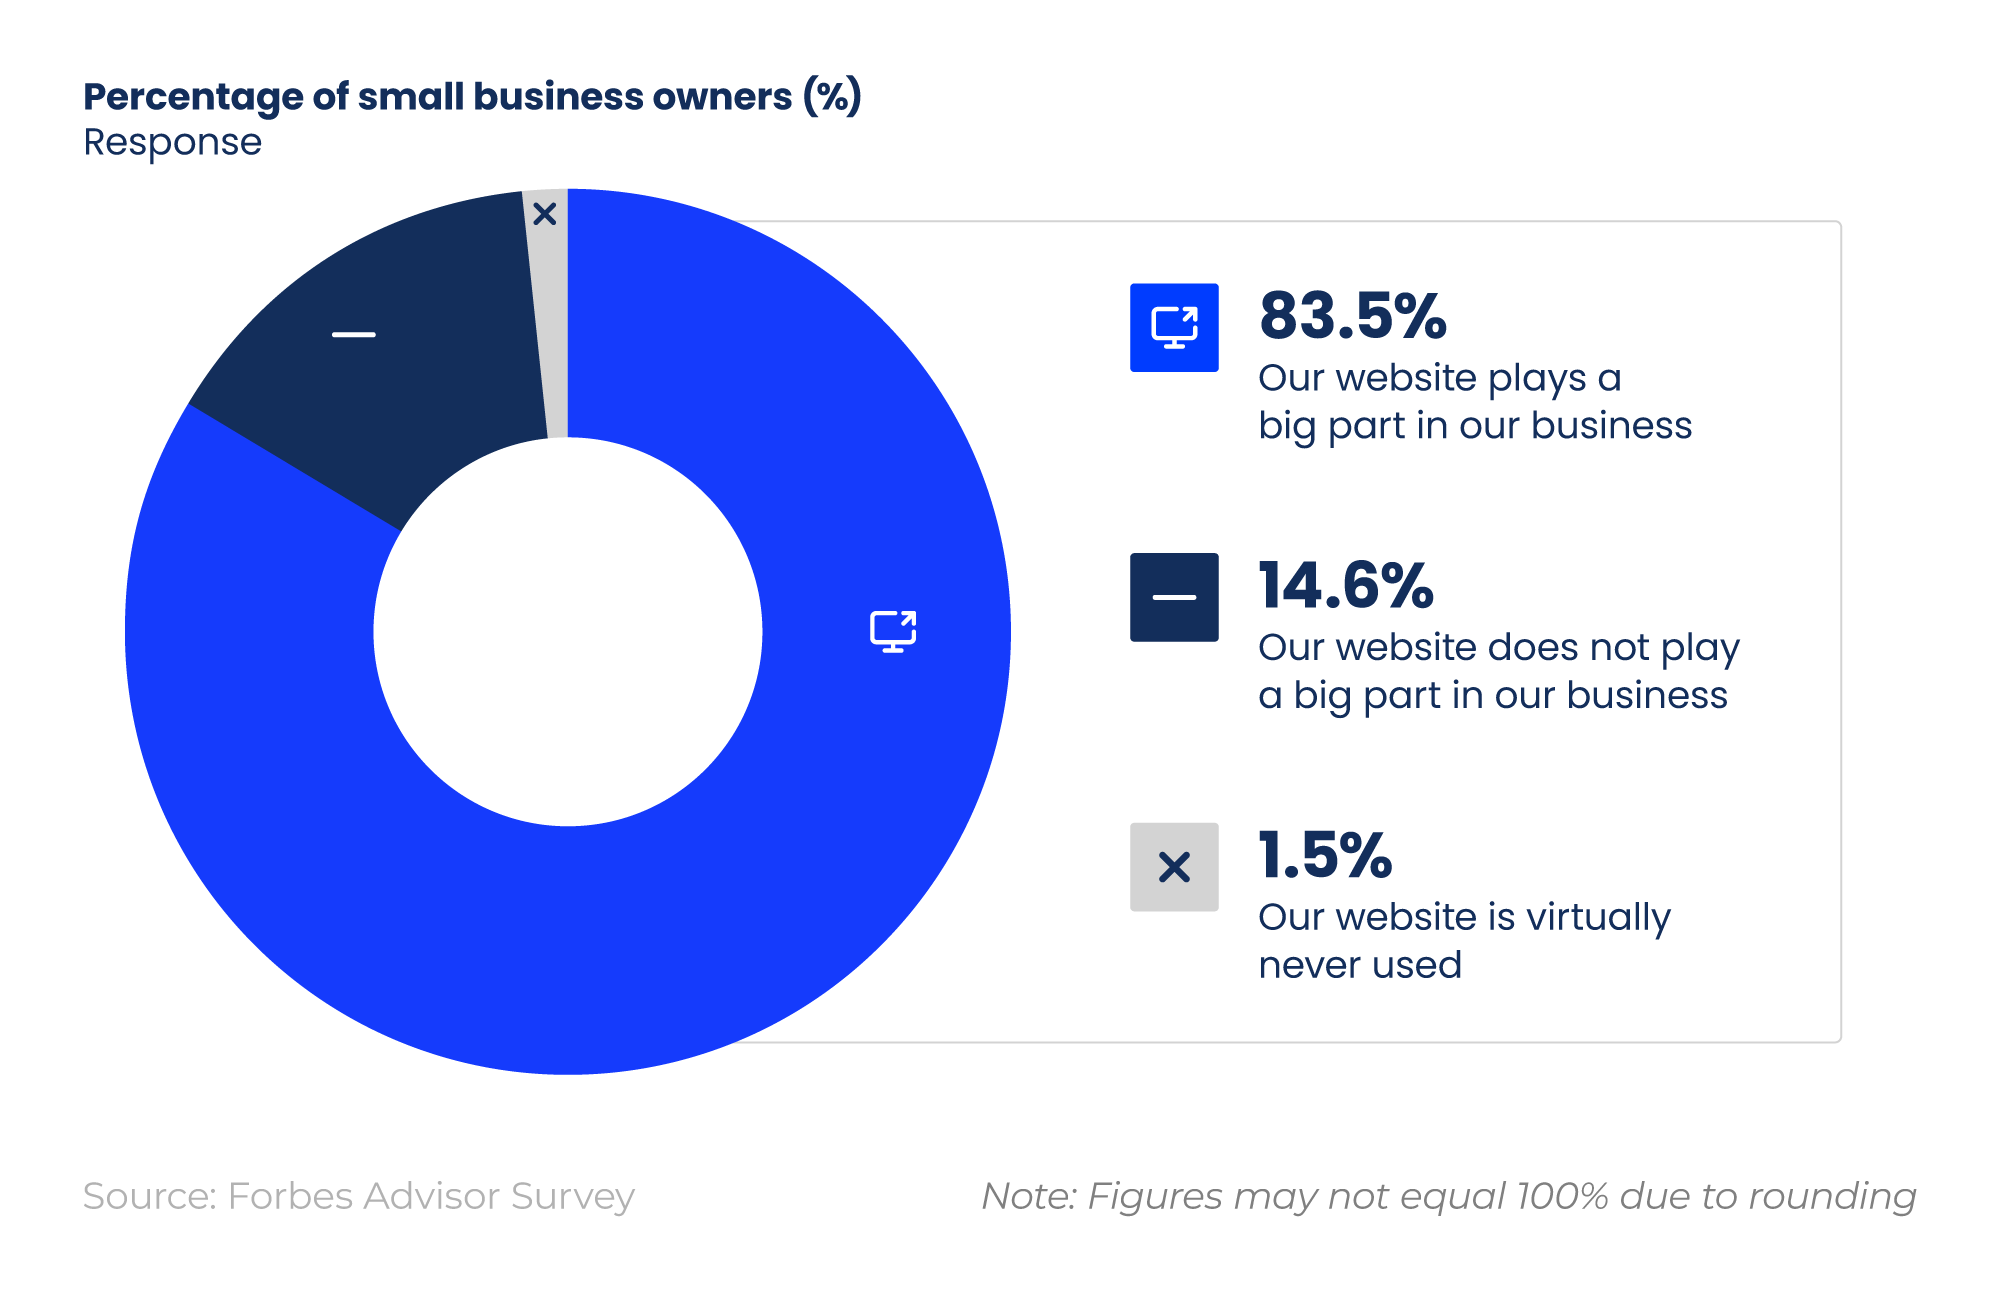
According to a Forbes Advisor survey, 78% of small business owners currently have a website in place for their business.
Among SME owners with a website, the overwhelming majority (83.5%) say it plays a significant role in their business, with just under 15% stating the opposite.
Incidentally, just 1.5% of small business owners claim their website is never used.
Partnering with an experienced eCommerce SEO agency could help drive meaningful online business growth and improve your ROI. Get in touch to find out how we can help your business.
Contact us
Small business website statistics and how SMEs update/maintain their website
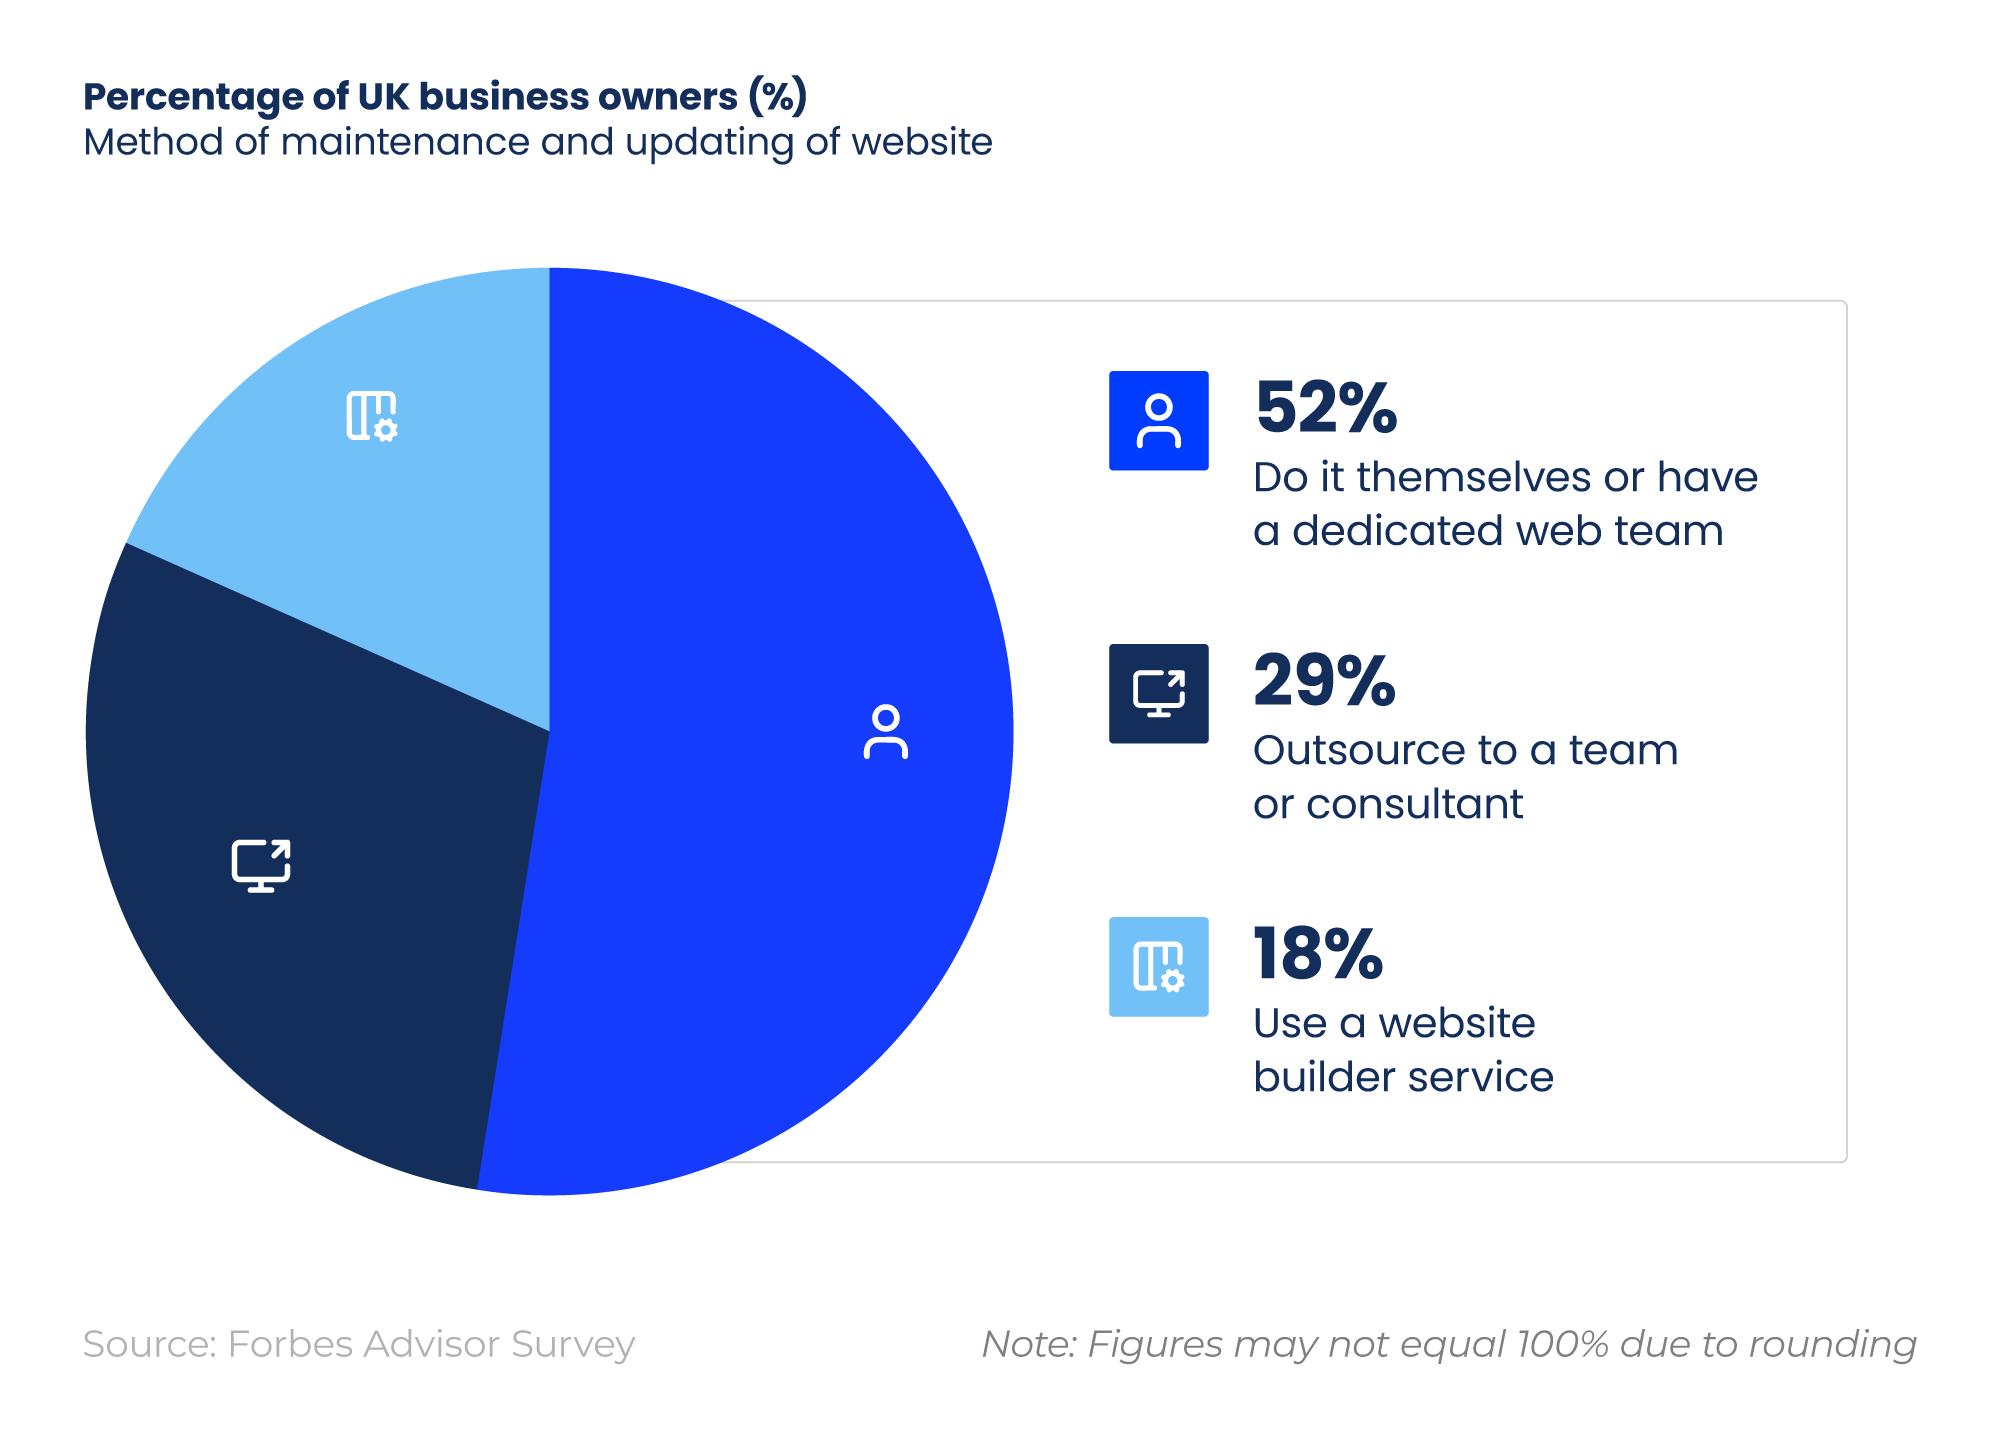
Just over half of SME owners with a website either maintain it themselves or have a dedicated in-house web development team, making it the most popular option among small businesses.
Around a third outsource their web development, with less than a fifth opting for a website builder such as Squarespace or Wix.
Small business website statistics and the most popular website builder services used by SMEs
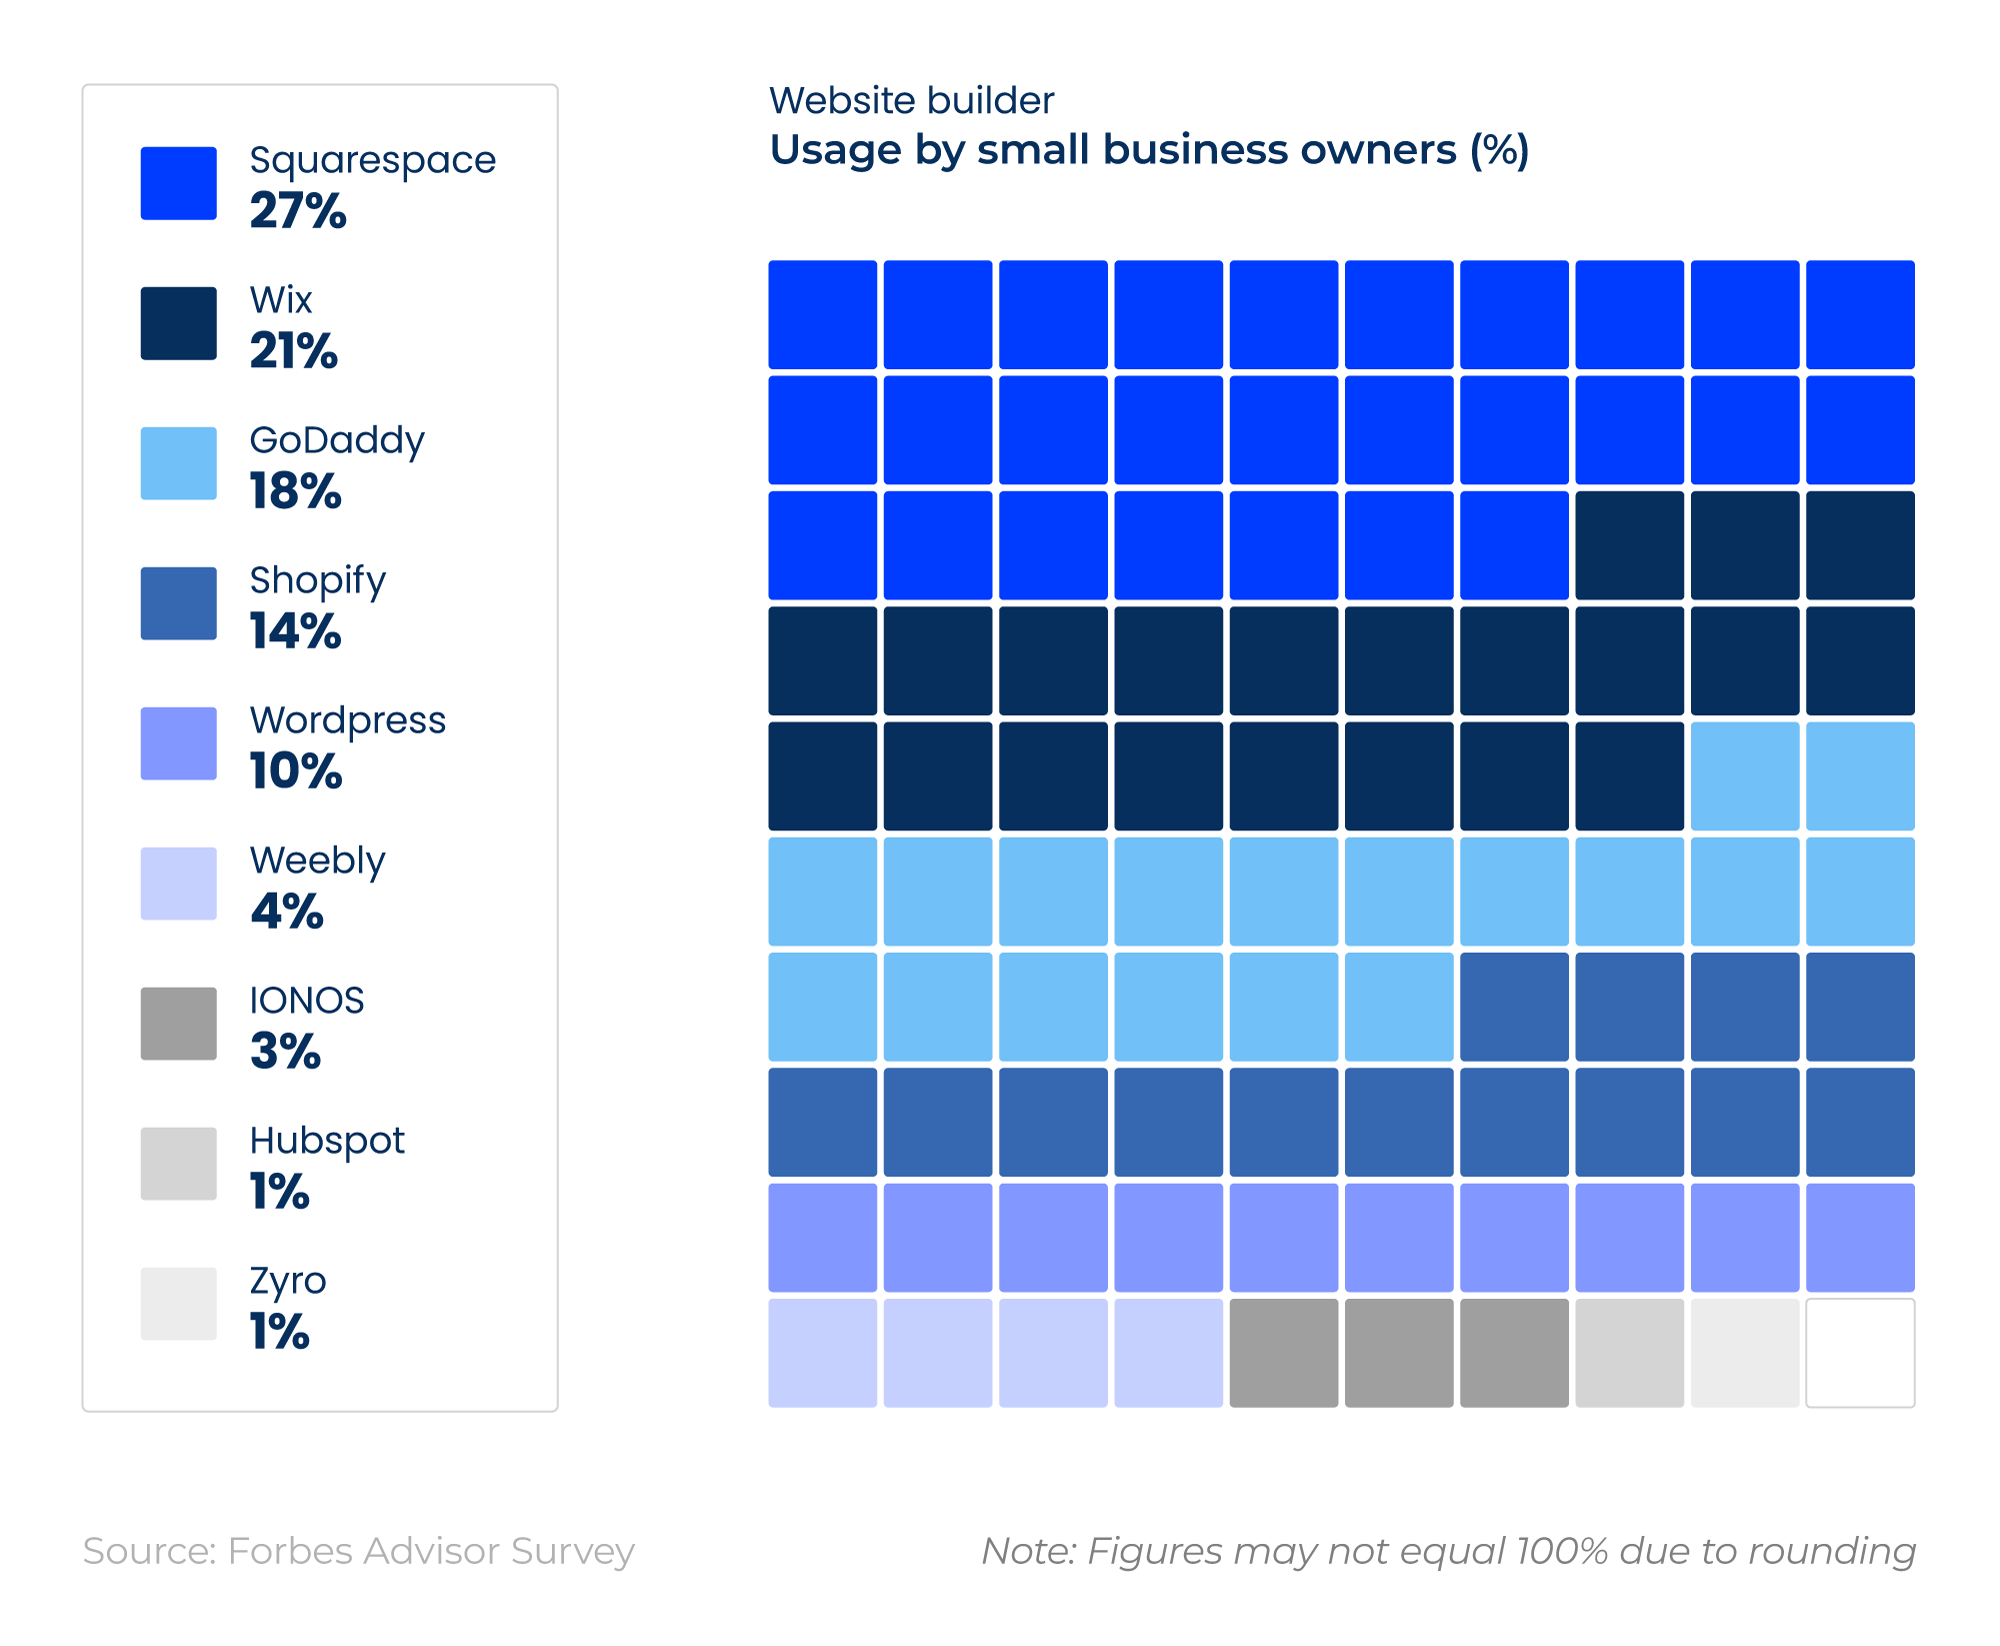
According to the Forbes Advisor survey, more than a quarter of SMEs using a web builder service choose Squarespace, with just over a fifth opting for Wix.
Small business website statistics and whether SMEs without a website think they should have one
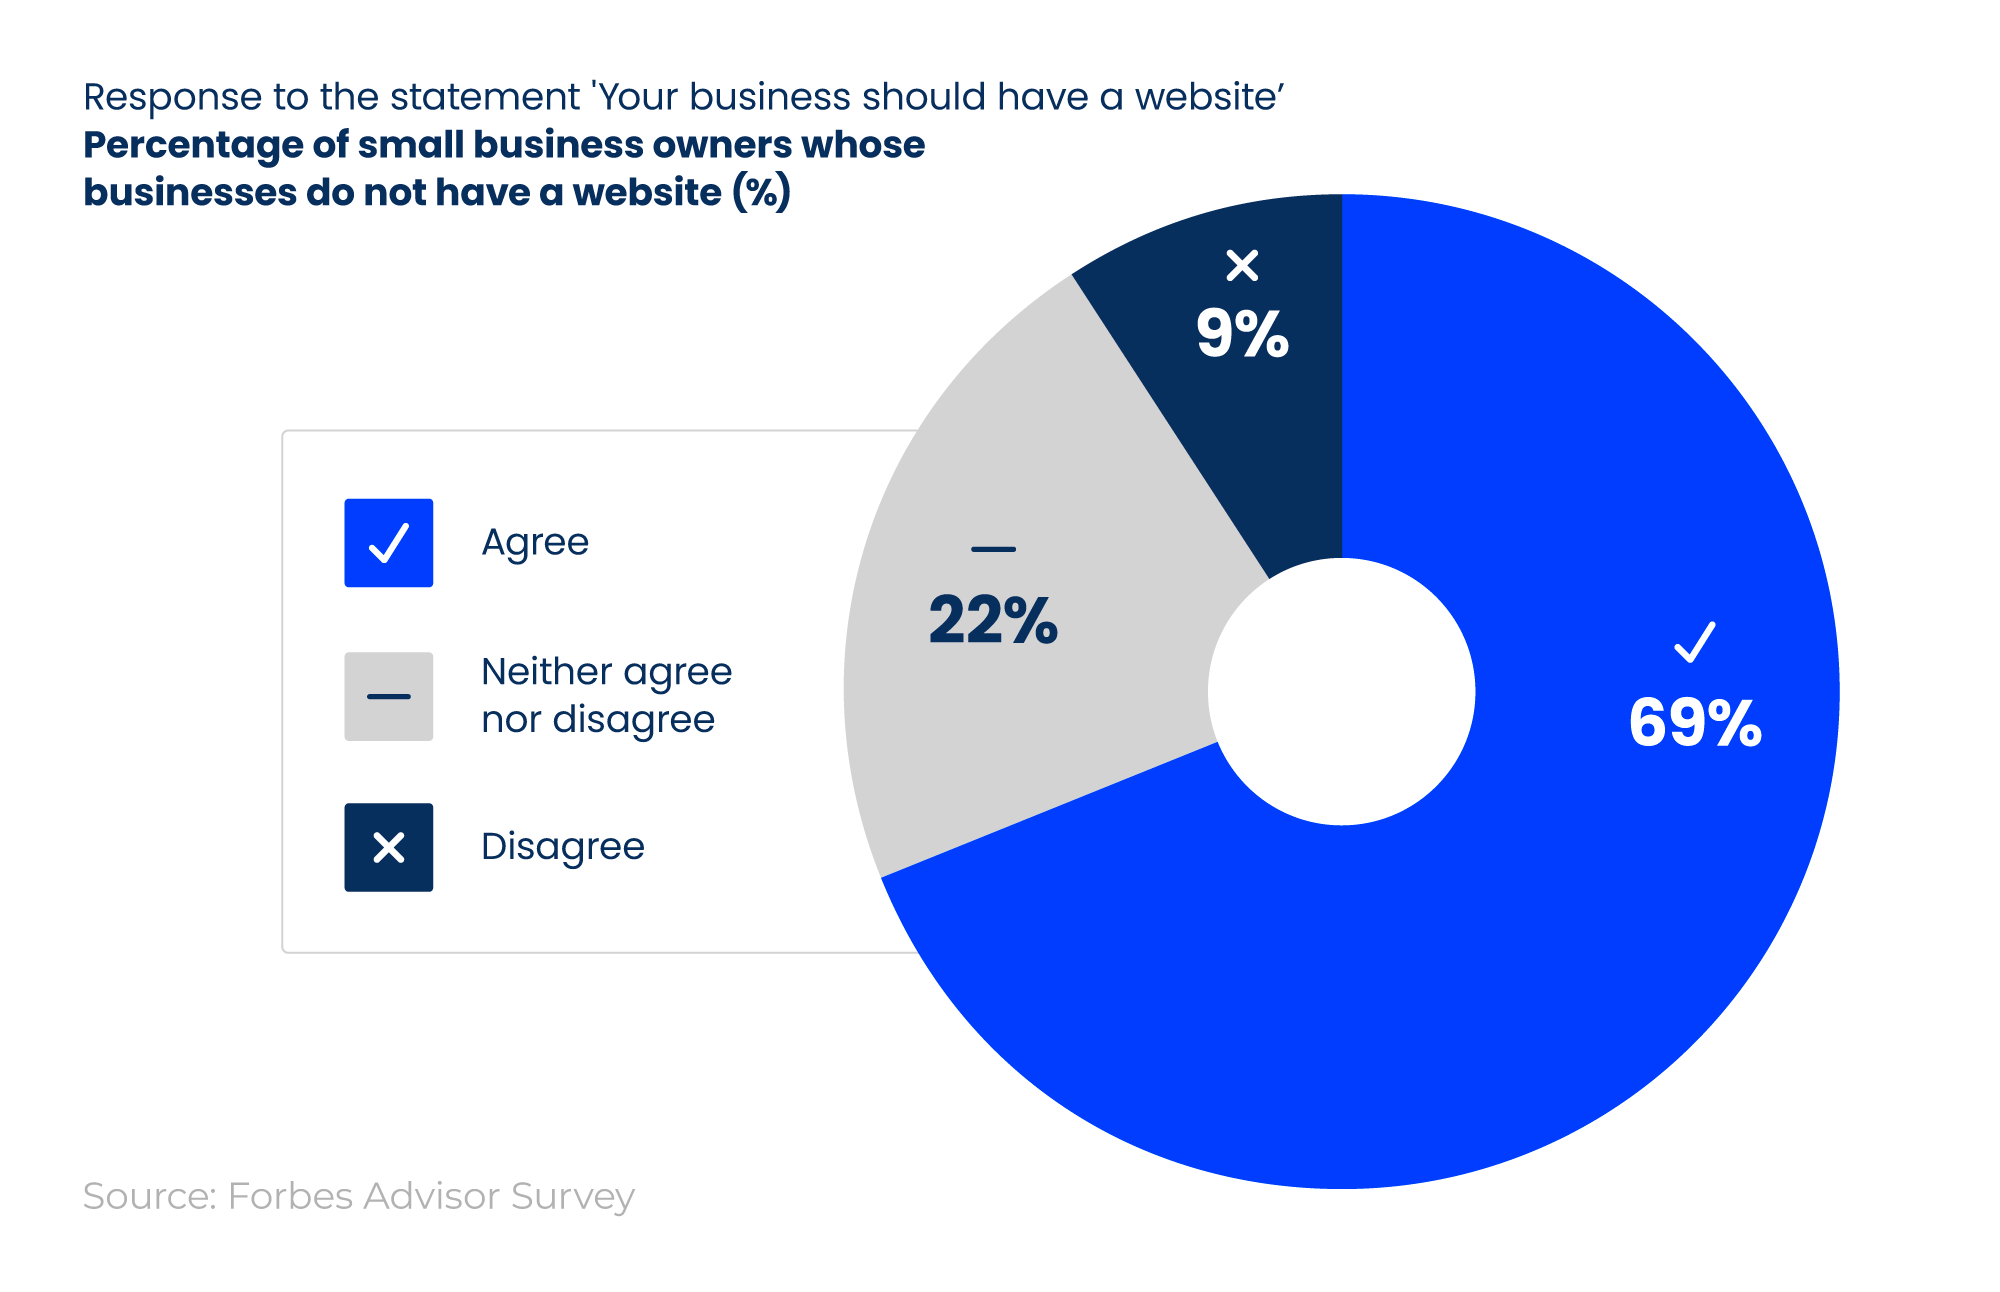
Nearly seven in 10 SME owners without a website believe their business should have one, compared to less than one in 10 who don’t.
Global eCommerce website statistics
With more than six billion internet users worldwide, the number of people making online purchases continues to rise. The global retail eCommerce market was estimated to reach a value of $6.9 trillion by the end of 2025.
The number of digital buyers worldwide is estimated at around 2.77 billion — roughly one in three of the global population who shop online.
Ecommerce sales accounted for 20.5% of global retail sales in 2025, with forecasts suggesting this figure could reach 22.5% by 2028.
Partnering with a digital PR agency can help you gain authoritative coverage and links from a wide range of publications, bolstering brand awareness and expanding your reach among your target audience.
Digital PR services
Internet sales as a percentage of retail sales in the UK over time (2007 to 2025)
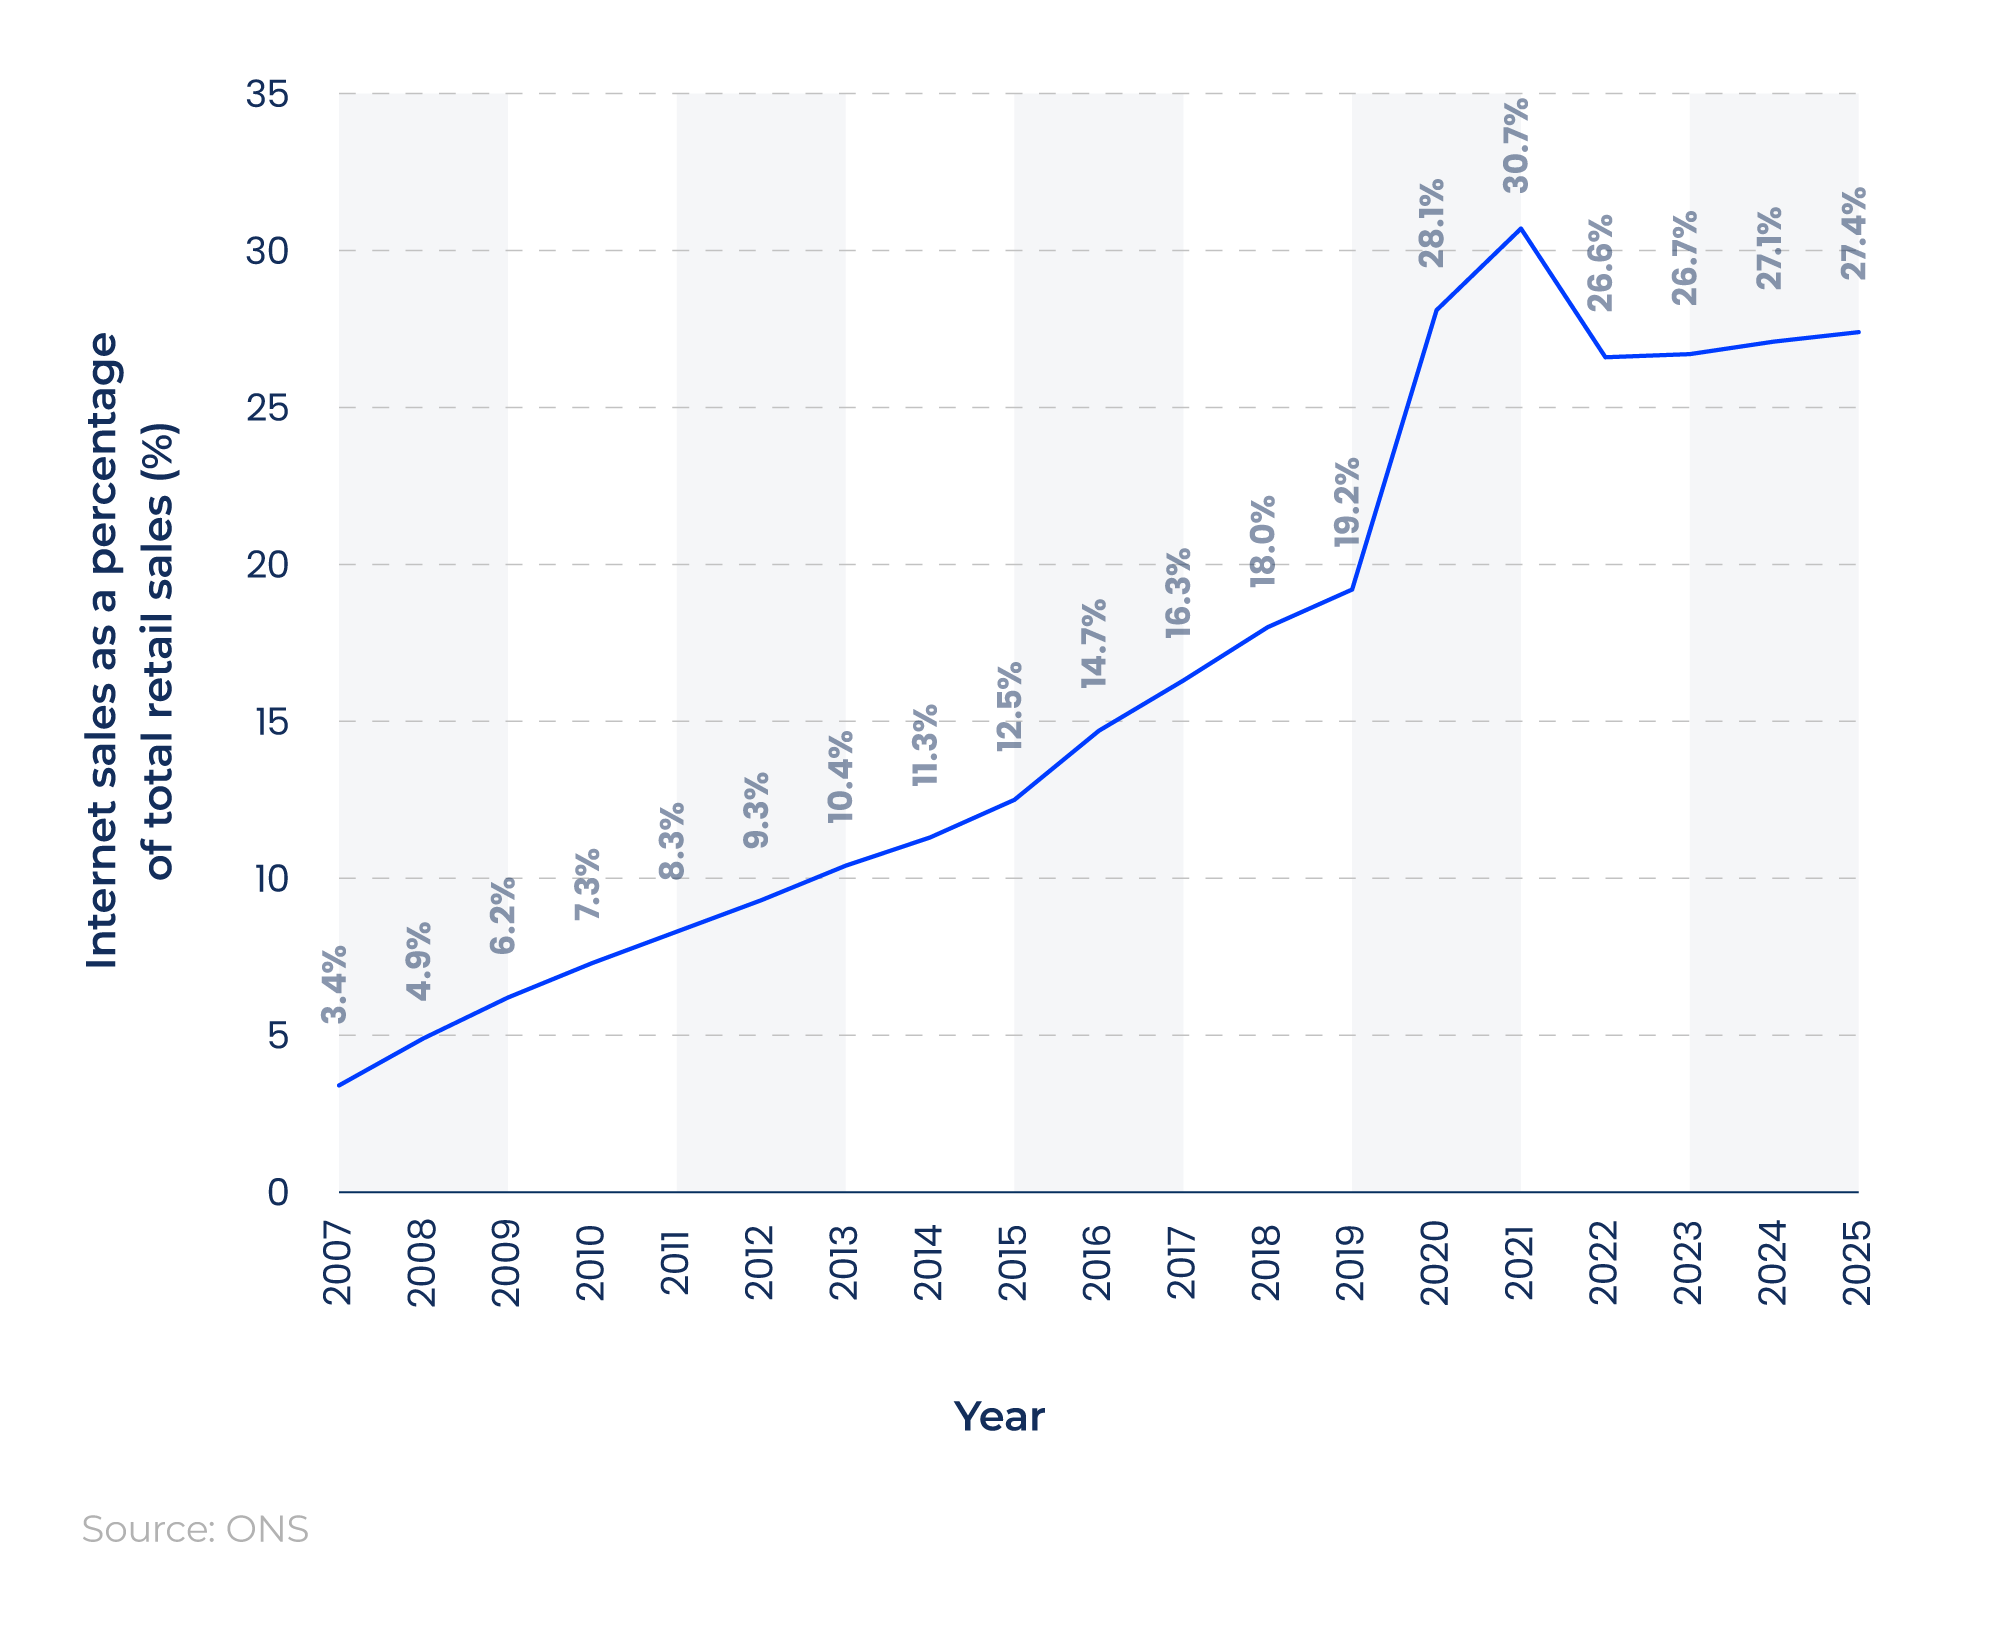
In the UK, data from the Office for National Statistics indicates that eCommerce sales accounted for 27.4% of all retail sales in 2025. This was the highest figure since the pandemic-influenced boom of 28.1% and 30.7% between 2020 and 2021.
This figure represents an increase of 119.2% from 2015, when the percentage of internet sales was 12.5%.
For more information, download our eCommerce whitepaper.
Download
B2B eCommerce statistics
A study by VML evaluated the online search function of 23 B2B eCommerce websites and found that:
- Over 60% of B2B websites included filters that narrowed the initial search results by up to 25%.
- 74% didn’t have product images.
- 4% had the option to ‘add to cart’ or ‘add to favourites’ while shopping.
- 56% returned results for exact-match keyword searches.
- 90% of B2B customers look at 2-7 websites before making a purchase.
- 80% of B2B websites analysed didn’t offer a satisfactory zero-results experience.
- 40% of B2B websites cannot perform content searches.
Making simple changes to a B2B eCommerce website, such as adding product images, an ‘add to cart’ option, and search functions that support synonyms, could go a long way to enhancing the user’s online shopping experience.
This could increase the likelihood of consumers finding the product/service they desire, in turn boosting conversion rates.
Mobile usage in the B2B purchasing process has become the default position.
80% of B2B buyers claim to use their mobiles to research products, with 60% using a mobile to make a recent purchase. On mobile websites, the search function is vital, as smaller screens make browsing and navigation more difficult.
However, VML’s research found that 27% of B2B websites were underperforming in their mobile search experience.

For multinational B2B companies, the localisation feature is an important tool for helping users select the language that best suits them.
Yet 65% of websites analysed by VML reported issues with the language of their product data, with some listings failing to appear due to a language mismatch.
Global website hosting statistics
Global web hosting market
In 2025, revenue from the global web hosting market reached $149.3 billion and is projected to reach $178.76 billion in 2026.
With a projected CAGR of 17.8% between 2026 and 34, this means the market value could exceed $660 billion by 2034.
Global web hosting market size statistics over time (2025 to 2034)
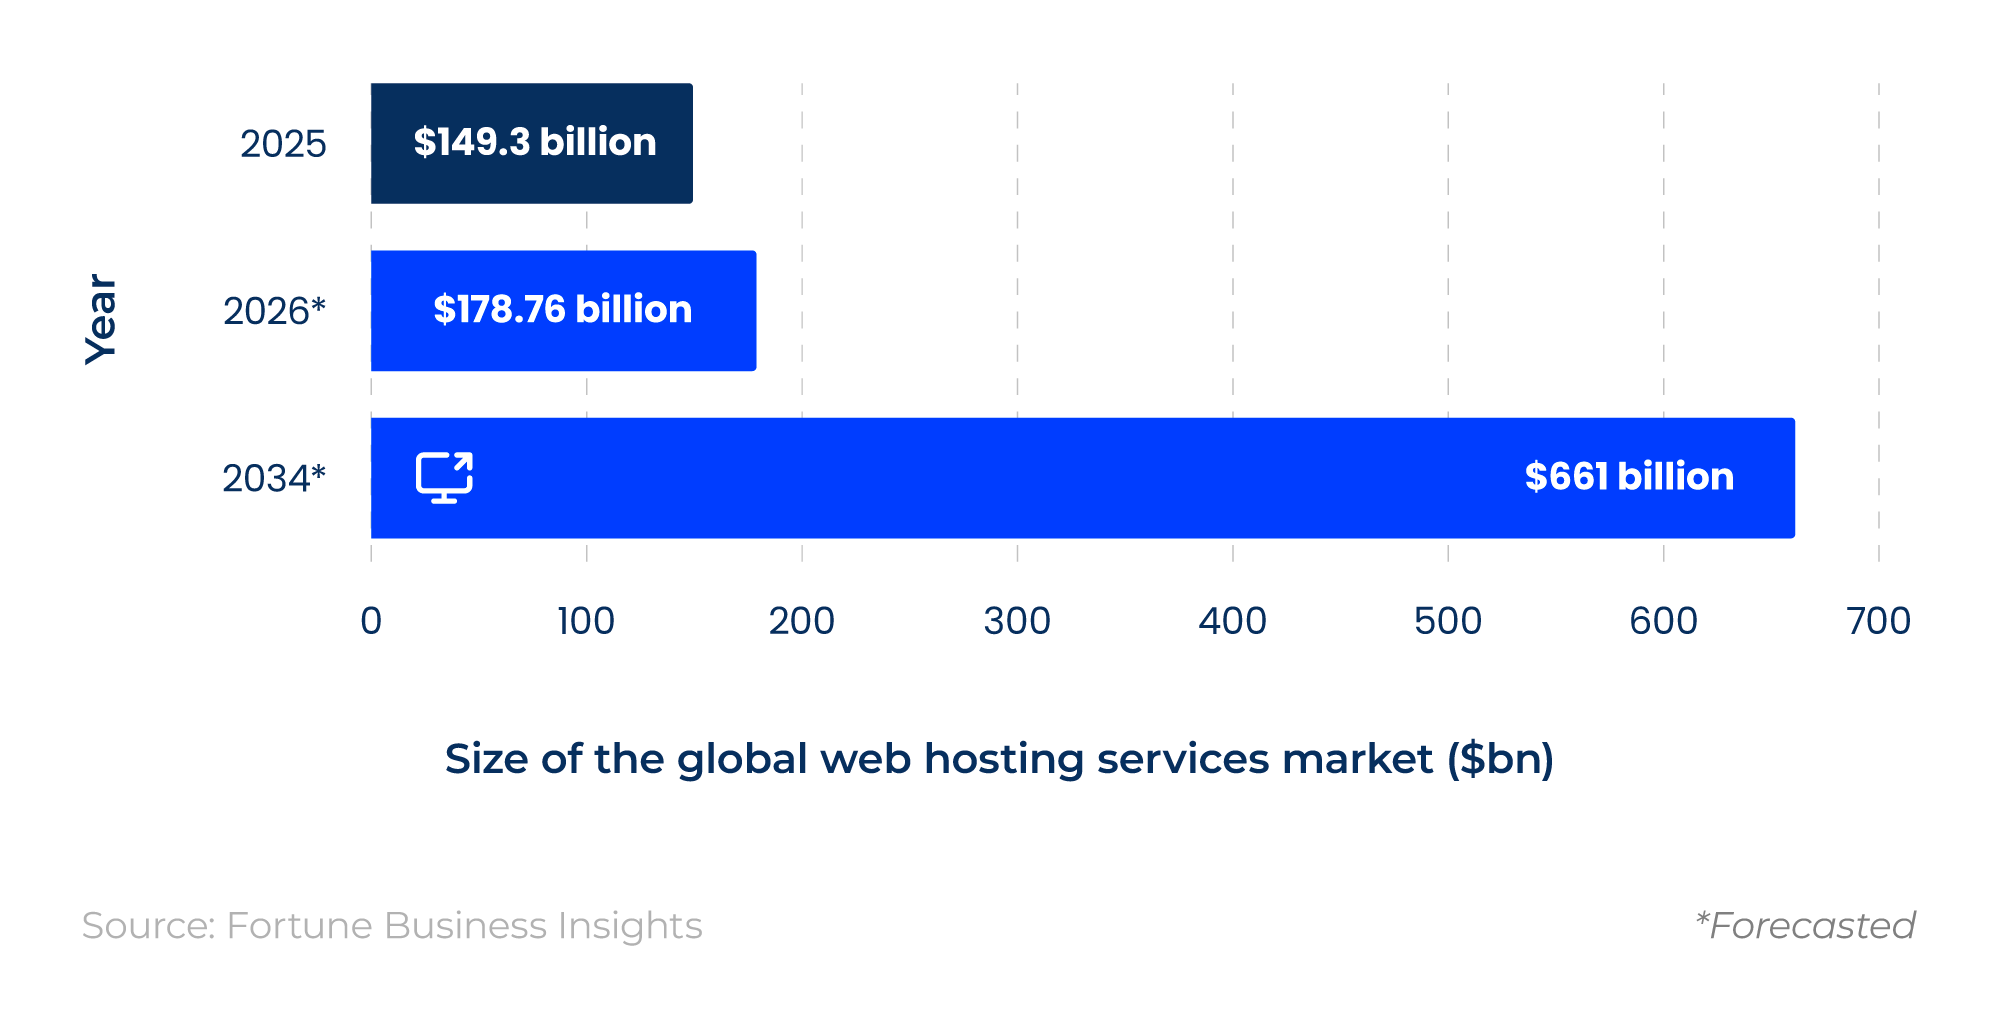
In global terms, the majority of 2025’s revenue (41%) was attributed to the North American market.
Global web hosting market share statistics
As of 2025, Shopify has the largest market share of global web hosting, at 5.1%.
Global web hosting statistics by the most common web hosting providers
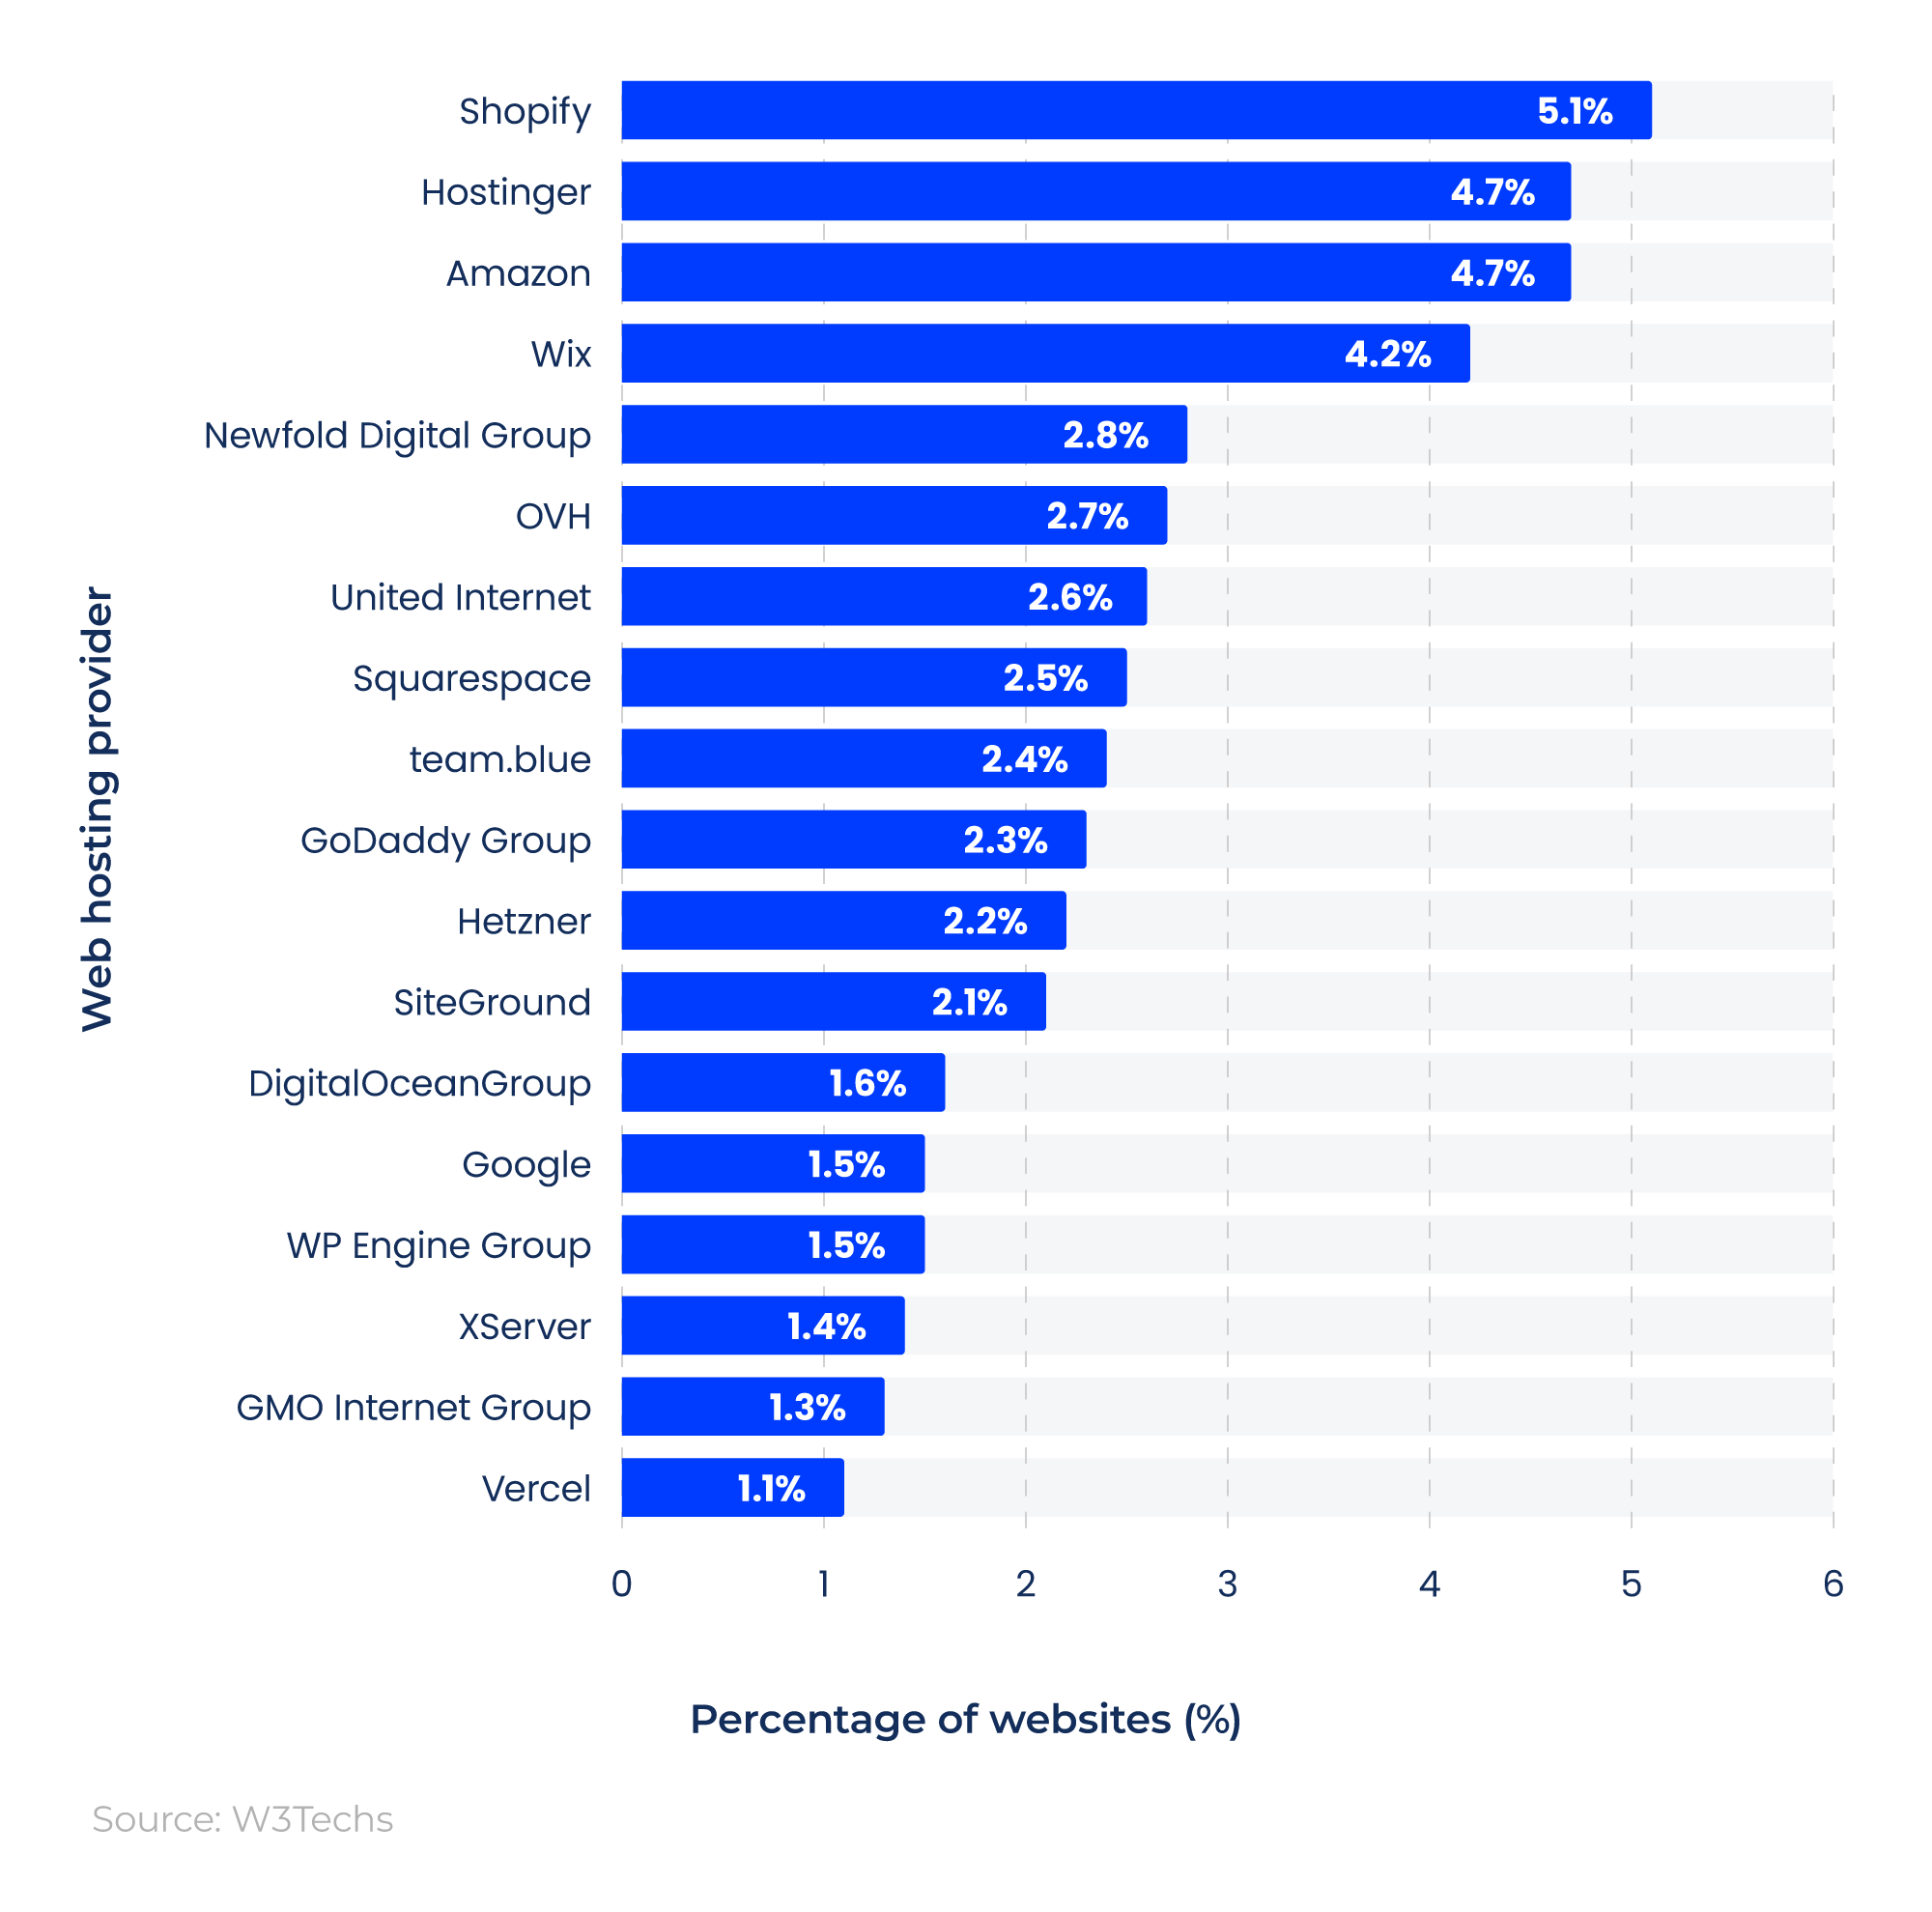
Hostinger and Amazon take joint second place, hosting 4.7% of all websites each, followed by Wix with 4.2%.
Web hosting outage statistics
Three of the top nine brands with the most reported outages in 2025 were web hosting companies.
The world’s biggest outages (2025)
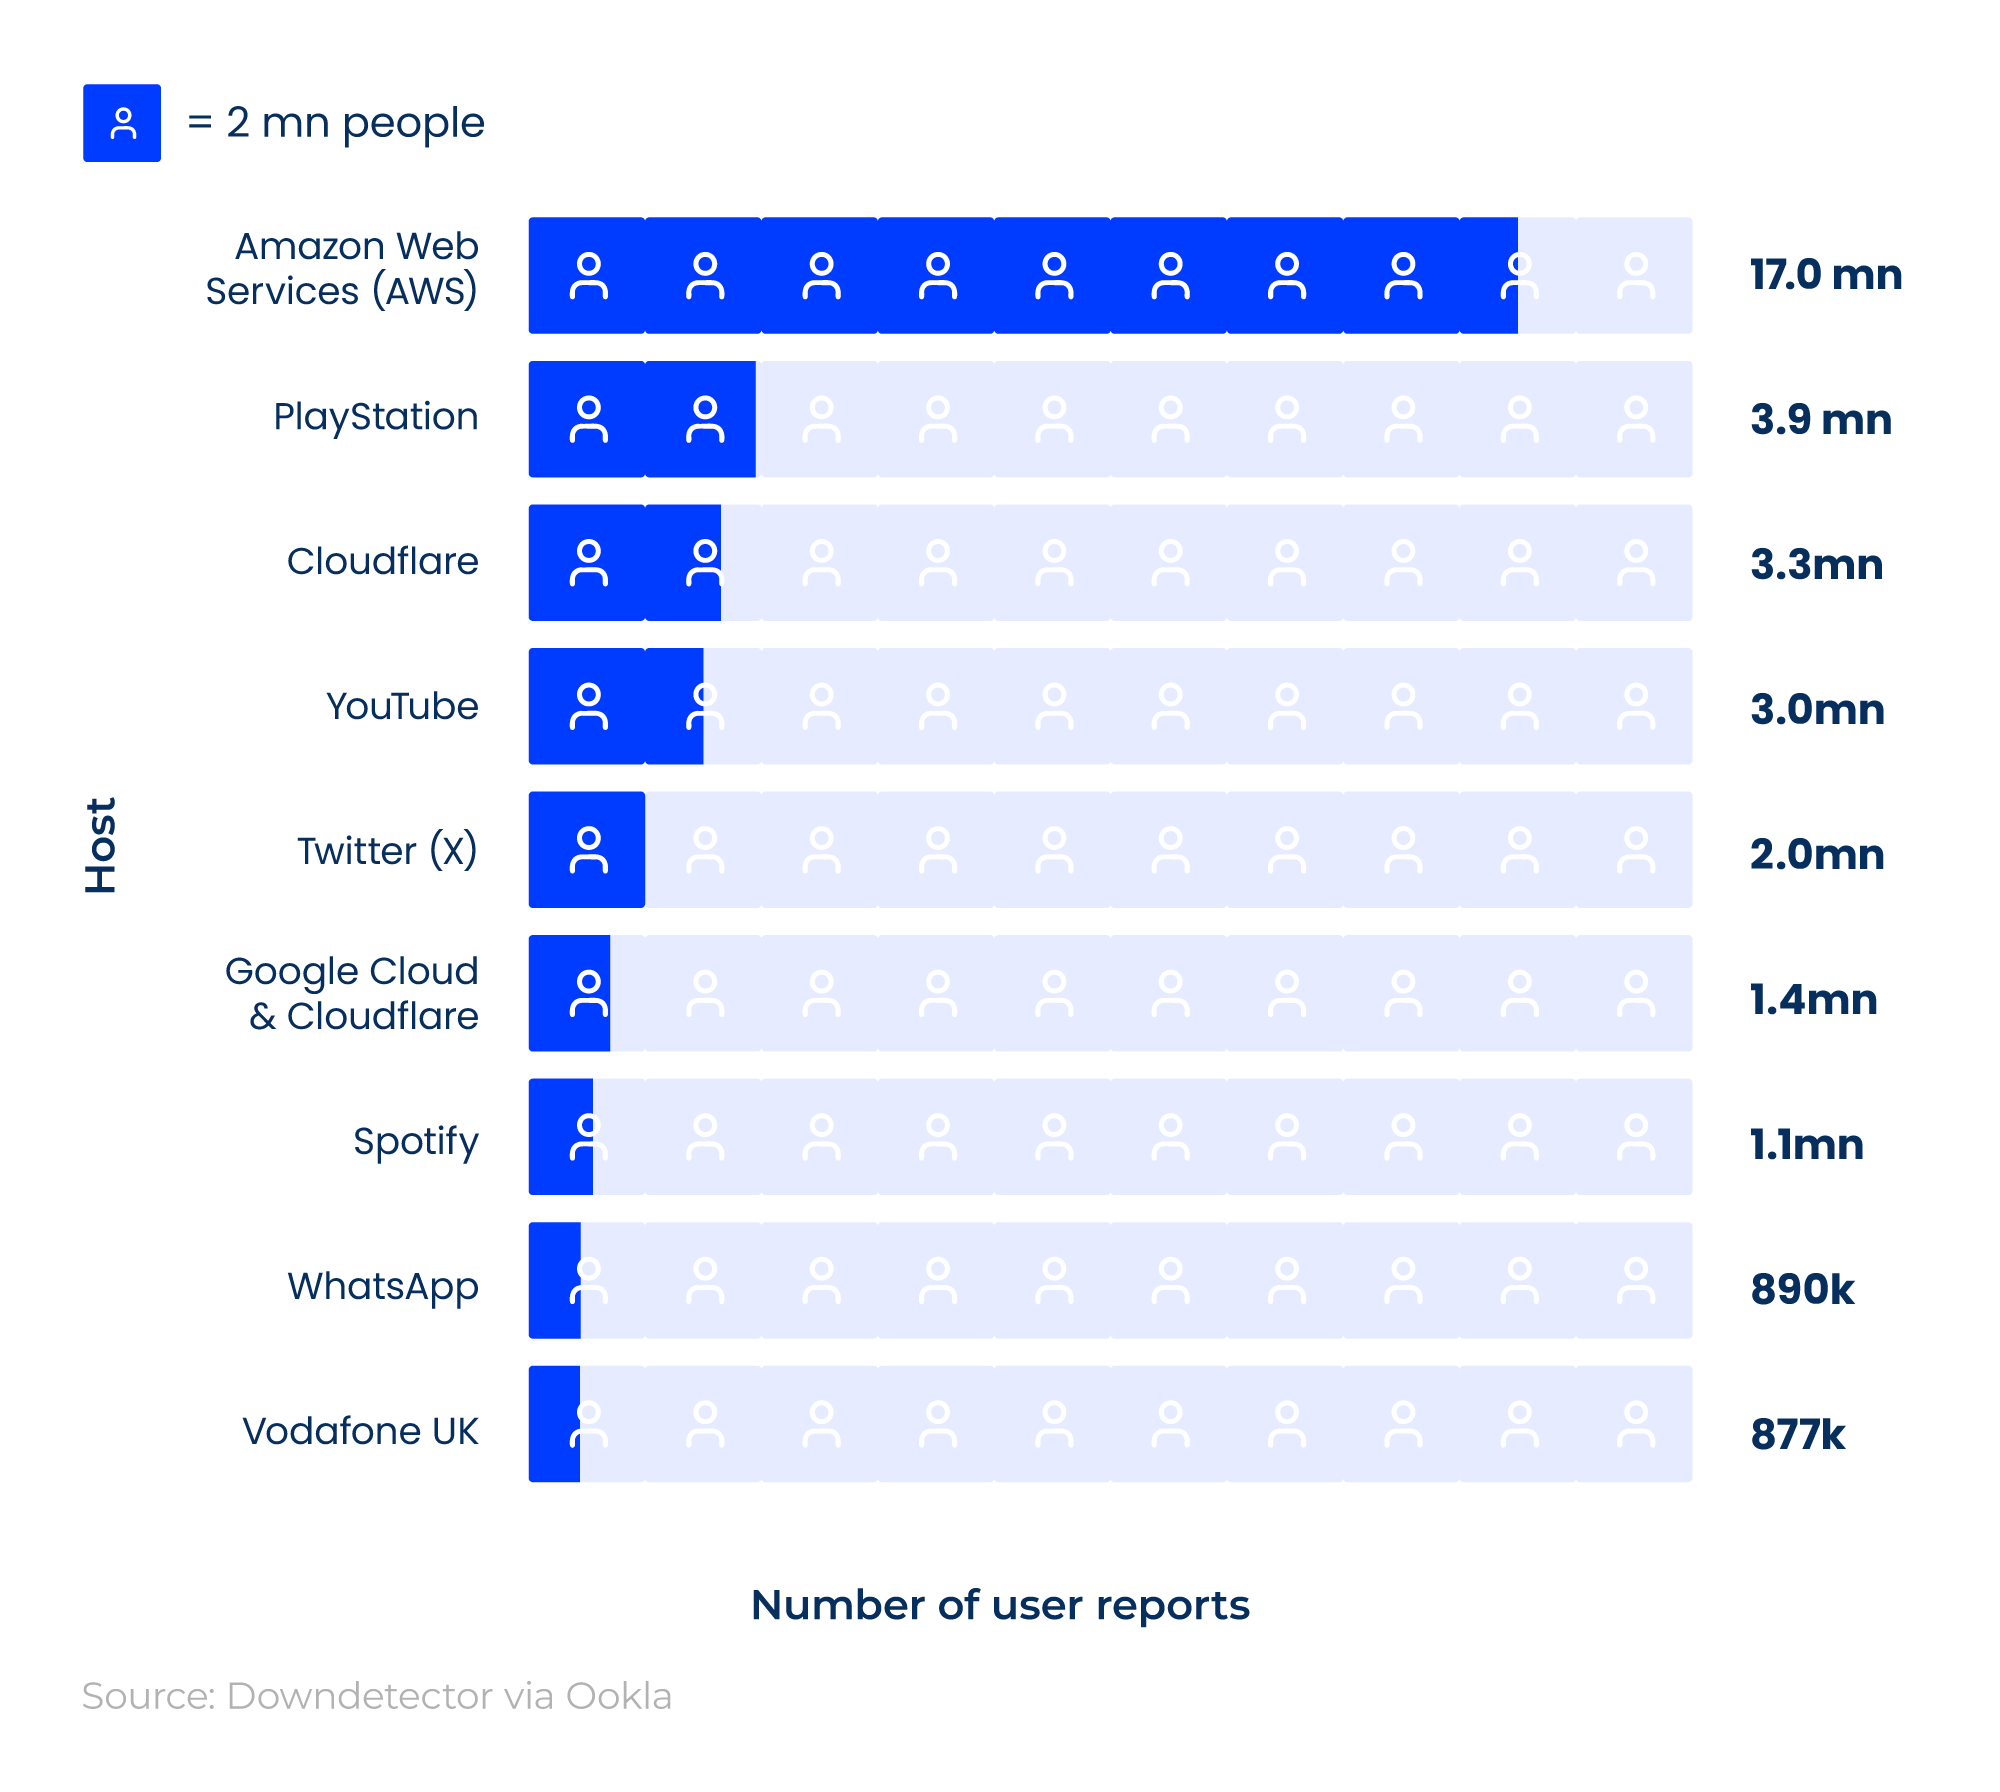
Amazon Web Services (AWS) had the most reported outages worldwide, totalling 17 million. This was more than four times that of Cloudflare's (3.3 million).
Global website security statistics
Most common website security risks around the world
According to OWASP, the biggest web security risk is broken access control, with more than 1.8 million occurrences and 32,654 Common Vulnerabilities and Exposures (CVEs) reported in 2025.
Top 10 web application security risks (2025)
The OWASP Top 10 is an awareness report for developers and web application security. It represents the most critical security risks to web applications based on the latest data and security trends.
See the OWASP website for a breakdown of the methodology and key terms listed above.
Security misconfiguration was the second most significant web security risk in 2025, with more than 719,000 occurrences and 1,375 CVEs. Its maximum incidence rate of 27.7% was the highest among the top 10 security risks.
Software supply chain failures ranked third, with the highest average incidence rate in 2025 at 5.72%. This was despite having almost nine times fewer occurrences and 3,000 fewer CVEs than broken access control incidents in the first position.
Most common types of security breaches or attacks for UK businesses (2024)
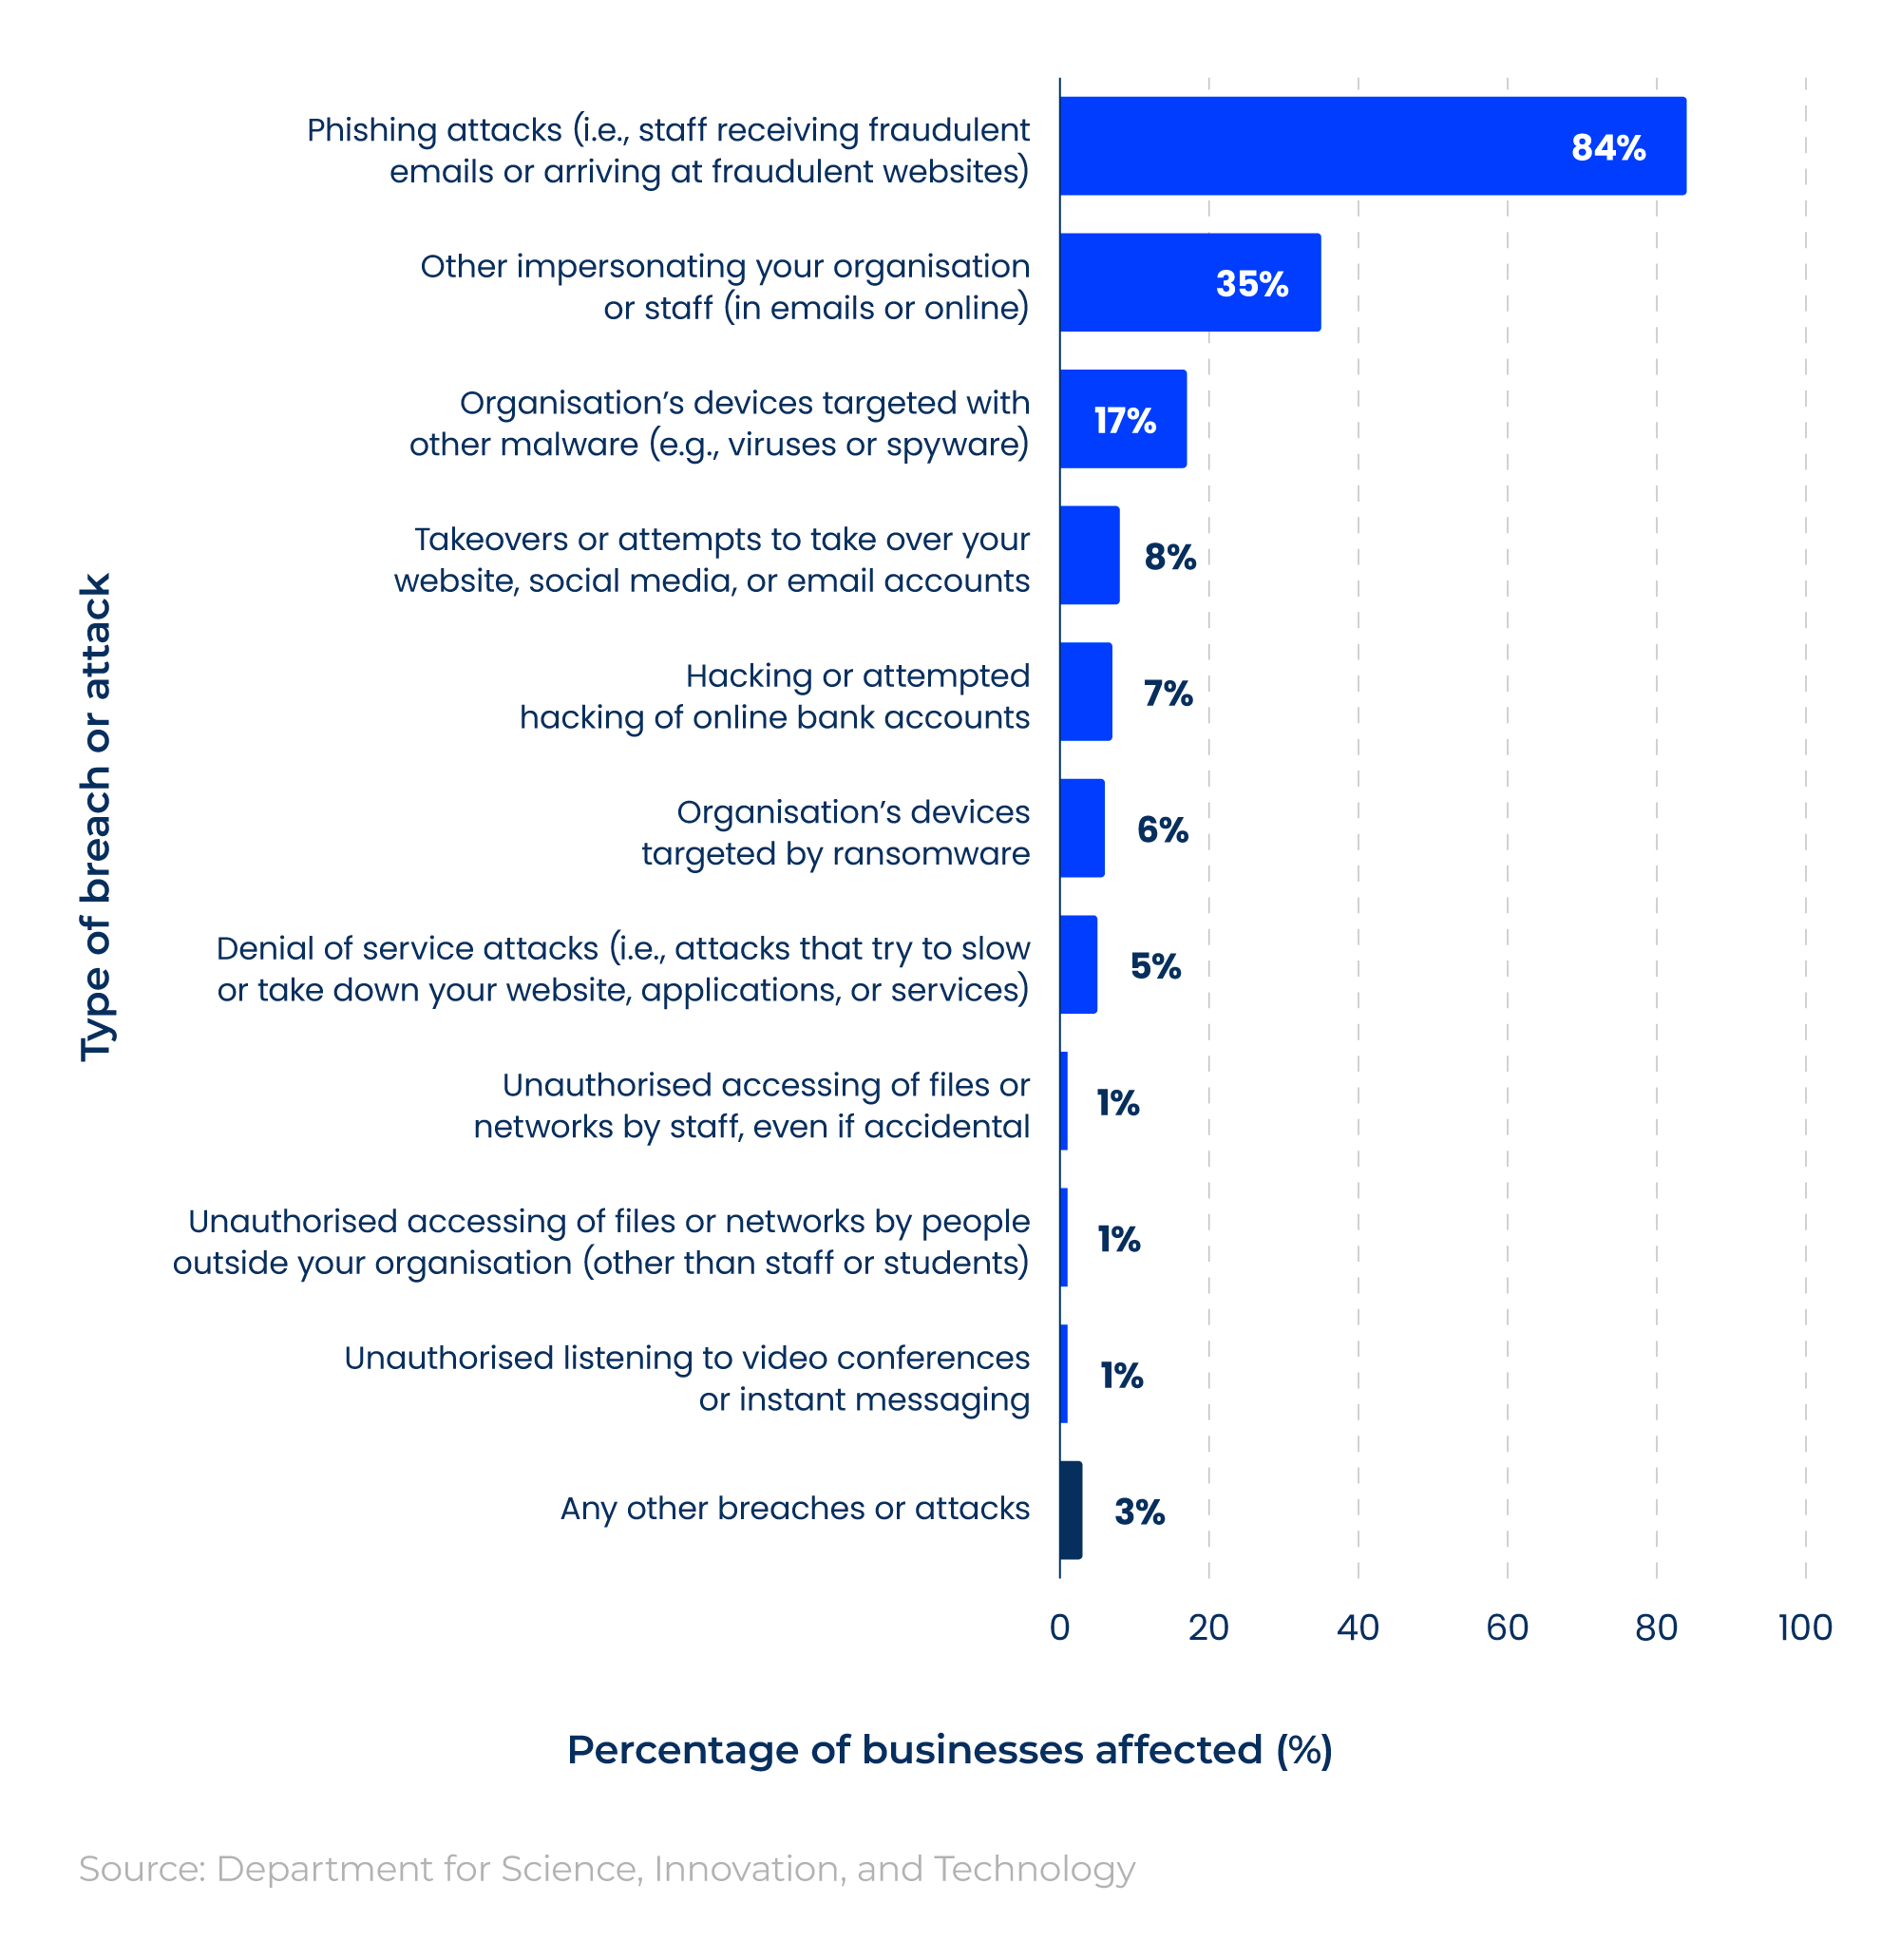
The most common security breach UK businesses faced in 2024 was phishing, such as staff receiving fraudulent emails or visiting fraudulent websites. This was reported by more than four-fifths of UK businesses.
This was followed by more than a third falling victim to impersonation scams and around a sixth of organisations being targeted by malware attacks.
Less than one in 10 businesses also faced an attempted takeover of their website, social media accounts, or email accounts in 2024.
Public attitudes towards website security
According to the Public Attitudes on Information Rights Survey 2025, 72% of adults admit to sharing at least one form of security information with others.
Survey data from the UK’s Information Commissioner’s Office found that:
- 61% of adults share their streaming service login details, while 44% share login information for online shopping sites.
- Three in 10 adults share their bank login details with others.
- 56% of those surveyed reported experiencing a data breach in the past 12 months.
While 18% stated this experience had no impact on them, the same proportion reported financial losses, and 35% reported a loss of trust.
Public opinion on website trust signals
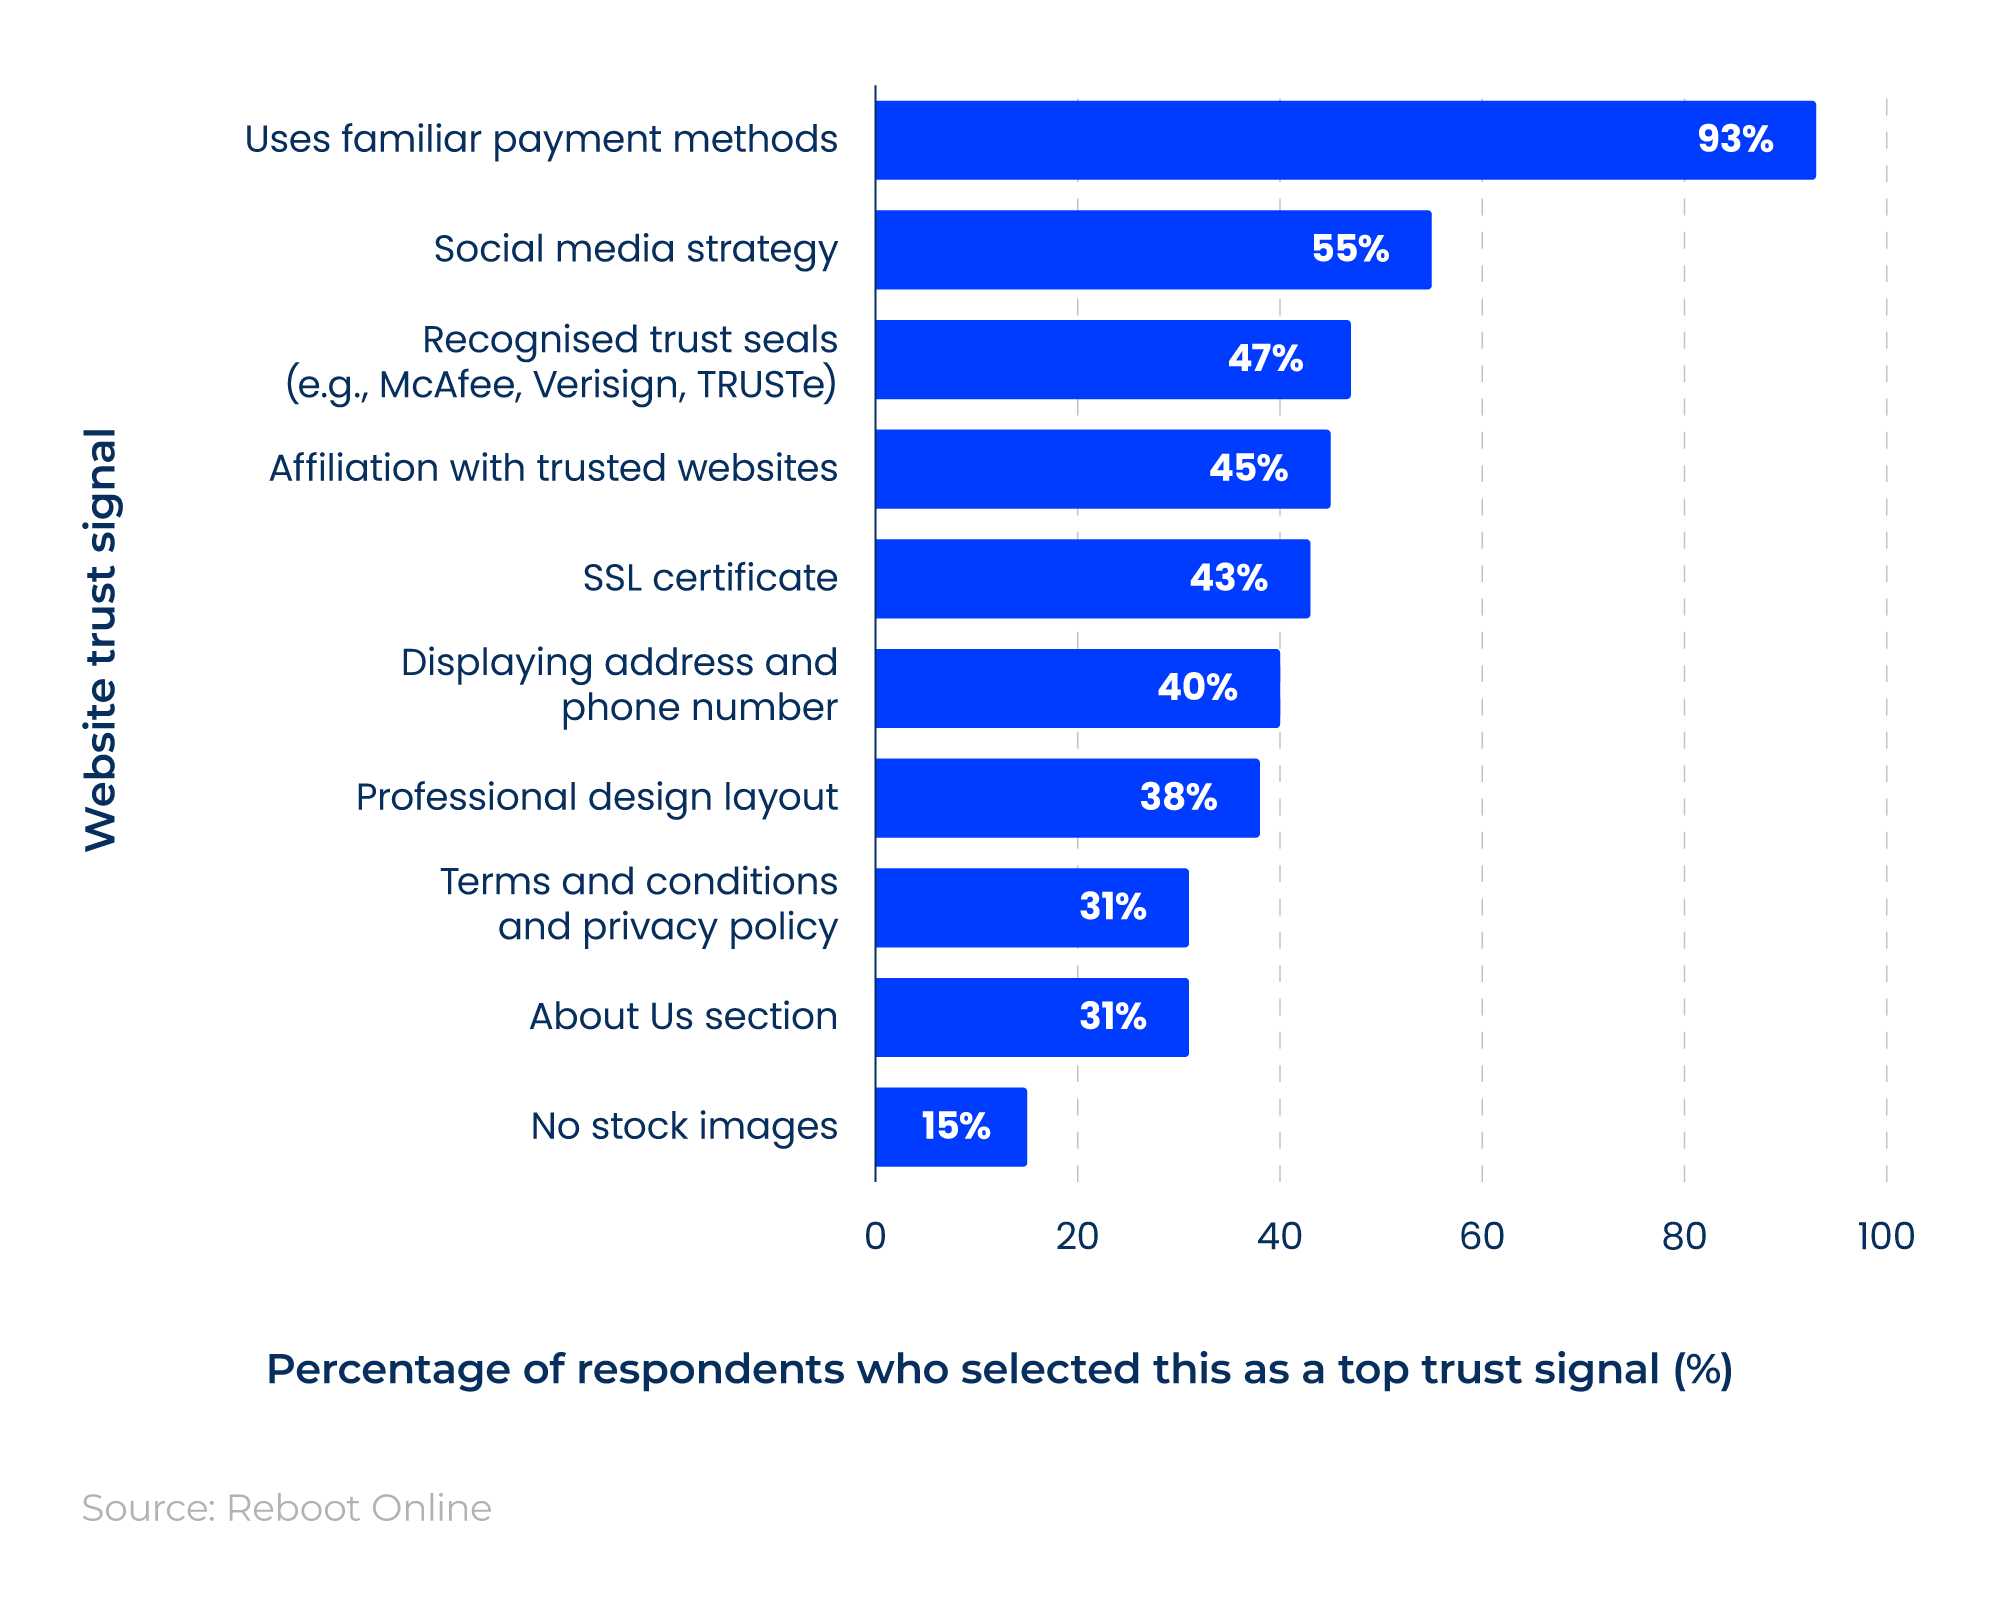
We surveyed 1,322 internet users to reveal the 10 most effective website signals that help rankings.
Around nine in 10 people placed familiar payment methods as their most important trust signal for a website.
This was followed by 55% who deemed social media activity a significant website trust signal, with 45% claiming they wouldn’t use a website that wasn’t active on Twitter (X), Facebook, or Instagram.
For more information, our guide on the importance of social media for business covers how a dedicated social media strategy can benefit your company and drive traffic to your website.
Read more
Website access and VPN statistics
According to Surfshark, there are approximately 1.75 billion global users of virtual private networks (VPNs).
With a total internet population of 6.04 billion, that means almost a three in 10 internet users use a VPN.
Just under half of global internet users (2.6 billion) live in countries where VPN use is restricted in some form.
Countries with restricted VPN use include:
- Belarus
- China
- Egypt
- India
- Iran
- Iraq
- Myanmar
- Oman
- Pakistan
- Russia
- Tanzania
- UAE
- Turkey
- Turkmenistan
- Uganda
Surfshark survey data shows the most common reasons for using a VPN are work (50.2%), security (23.5%), and gaming (14.7%).
In July 2025, half of the top 10 free apps in Apple’s download chart were for VPN services, with one app maker claiming a 1,800% increase in downloads. This is, however, a spike. It’s unclear if this increase is sustained due to restrictions placed on the internet and a lack of historic data.
As countries introduce new legislation, such as the UK’s Online Safety Act, VPN usage may increase to help bypass mandated platforms for adult content. This could affect how and where people access certain websites.
Website statistics FAQs
How much traffic does a website get?
Website tracking tools like Semrush, Ahrefs, and Similarweb only ever estimate how much traffic a website gets.
While they’ll not provide you with exact figures, these web tracking tools will indicate how many people visit your website, allow you to compare this with your competitors, and see what keywords you’re both ranking for.
How to increase website traffic
Many things can be done to increase website traffic, such as:
- Create high-quality, engaging content optimised for specific keywords on targeted landing pages.
- Obtain backlinks from trustworthy sources.
- Engage with your target audience, influencers, and community on social media to increase your brand visibility.
- Optimise your website using SEO services, including local searches.
- Include testimonials from satisfied customers on your website.
- Send out emails (e.g., newsletters and promotions) that link back to your website.
- Use paid digital ads on social media to promote your site, either yourself or by enlisting the services of a digital PR company.
How to check website traffic
The easiest way to check website traffic is to use a designated website tracking tool, such as Semrush, Ahrefs, or Similarweb. However, you’ll need to pay for these.
There are some free website tracking tools, such as Sitechecker, that can be used in a limited capacity.
Can you make money from website traffic?
Websites can earn ad revenue based on monthly page views and visits. By placing relevant adverts on your site, you can also earn money from each click or sale.
Affiliate marketing is also an option for promoting products or services from other companies, generating additional income, or becoming a host for sponsored content on your site.
Does website traffic increase Google's ranking?
Website traffic is a key indicator of your Google ranking. An increase in direct and organic traffic to your website signals to Google that your domain has high authority, popularity, and relevance.
As a result, your site should rank higher in search engine results pages (SERPs). However, web traffic alone doesn’t directly increase your Google ranking.
Sources
https://siteefy.com/how-many-websites-are-there/
https://www.netcraft.com/blog/december-2025-web-server-survey
https://datareportal.com/reports/digital-2026-global-overview-report
https://research.domaintools.com/statistics/tld-counts/
https://www.azoma.ai/insights/most popular-large-language-models
https://gs.statcounter.com/search-engine-market-share
https://webaim.org/projects/million/
https://www.cognitivemarketresearch.com/web-design-services-market-report
https://serpwatch.io/blog/web-design-statistics/
Lindgaard, G. et al. (2006) “Attention web designers: You have 50 milliseconds to make a good first impression!,” Behaviour & information technology, 25(2), pp. 115–126. doi: 10.1080/01449290500330448.
https://wordpress.com/pricing/
https://www.squarespace.com/pricing
https://www.jimdo.com/pricing/website/
https://www.webnode.com/pricing-w2/
https://www.godaddy.com/en-uk/pricing
https://www.shopify.com/uk/pricing
https://www.weebly.com/pricing?lang=en_GB
https://squareup.com/gb/en/online-store/plans
https://www.bitrix24.uk/prices/
https://www.forbes.com/advisor/business/software/how-long-build-website/
https://www.orbitmedia.com/blog/website-lifespan-and-you/
https://www.storyblok.com/mp/poor-website-user-experience
https://sqmagazine.co.uk/cms-market-share-statistics/
https://w3techs.com/technologies/history_overview/content_management/all/y
https://www.sagefrog.com/resources/2025-b2b-marketing-mix-report/
https://www.sagefrog.com/resources/2025-b2b-marketing-mix-report/
https://www.sagefrog.com/resources/2023-b2b-marketing-mix-report/
https://www.sagefrog.com/resources/2023-b2b-marketing-mix-report/
https://www.sagefrog.com/resources/2023-b2b-marketing-mix-report/
https://www.sagefrog.com/resources/2023-b2b-marketing-mix-report/
https://www.forbes.com/advisor/uk/business/software/website-statistics/
https://www.yaguara.co/global-ecommerce-sales-growth/
https://www.vml.com/insight/the-state-of-b2b-site-search
https://www.ons.gov.uk/businessindustryandtrade/retailindustry/timeseries/j4mc/drsi
https://www.fortunebusinessinsights.com/industry-reports/web-hosting-services-market-100863
https://w3techs.com/technologies/overview/web_hosting
https://www.ookla.com/articles/largest-outages-of-2025
https://hostings.info/hosting/market-share
https://ncsi.ega.ee/ncsi-index/?order=rank
https://aag-it.com/the-latest-cyber-crime-statistics/
https://ico.org.uk/media2/veapck3h/ico-pair-2025-report.pdf
https://surfshark.com/blog/vpn-users
https://www.bbc.co.uk/news/articles/cn72ydj70g5o
Sources and methodologies for statistics on the most visited websites
- The top 100 most visited websites in January 2026 (as reported by Semrush) were analysed for a variety of performance metrics from Jan 2018 to Jan 2026 using Semrush traffic analysis.
- For each domain, the number of visits, unique visitors, pages/visit, average visit duration and bounce rate were obtained for every month, as were the yearly averages for each of the 100 domains.
- Note: 'microsoftonline.com', 'imdb.com', and 'fsbx.com' could not be analysed by Google Lighthouse and returned loading errors.
- For the forecasted data, a linear regression model was fitted to the historical data to forecast future values up to 2030. The model assumes the metrics continue to change at the same rate as over the period analysed.
Top websites in the world - top rankings January 2026 (2026) Semrush. Available at: https://www.semrush.com/website/top/ (Accessed: February 26, 2026)
Speed index (2019) Chrome for Developers. Available at: https://developer.chrome.com/docs/lighthouse/performance/speed-index (Accessed: February 26, 2026)