
THIS
POST
The Social Platforms With the Biggest Increase in Removed Content | 2019-2020

Like any business or service, social media platforms possess a duty of care towards their users. And when this duty of care is questioned, often because of a violation of their usage terms of service, they are bound by this duty to act upon said violations.
This duty of care is of greater importance than ever before as social media continues to attract younger audiences. And whilst the majority of platforms state in their terms and conditions that one must be over the age of 13 to have an account, kids and teens have been known to flood to the likes of TikTok, Instagram and Snapchat. Whilst Instagram and TikTok attempt to restrict their content to only registered users, YouTube, Facebook, and Twitter do not - therefore allowing those under the age of 13 to browse content that may be unsuitable.
Our research
In a bid to reveal which social media platforms are most likely to keep their community of users safe, our Digital PR services and SEO company team examined recent transparency reports from Twitter, YouTube, Facebook, TikTok, and Instagram for potential increases year-on-year for content removal, which includes posts, comments, and users.
What are transparency reports?
Transparency reports contain a lot of different information, but the most important section details how they are tackling violations of their terms and conditions so that consumers can feel safe.
As an example, TechCrunch reported that nearly four times the amount of subreddits on Reddit were removed in 2020 compared to 2019, in a bid to make the internet a safer place.
The social media platforms with the biggest increase in content violations
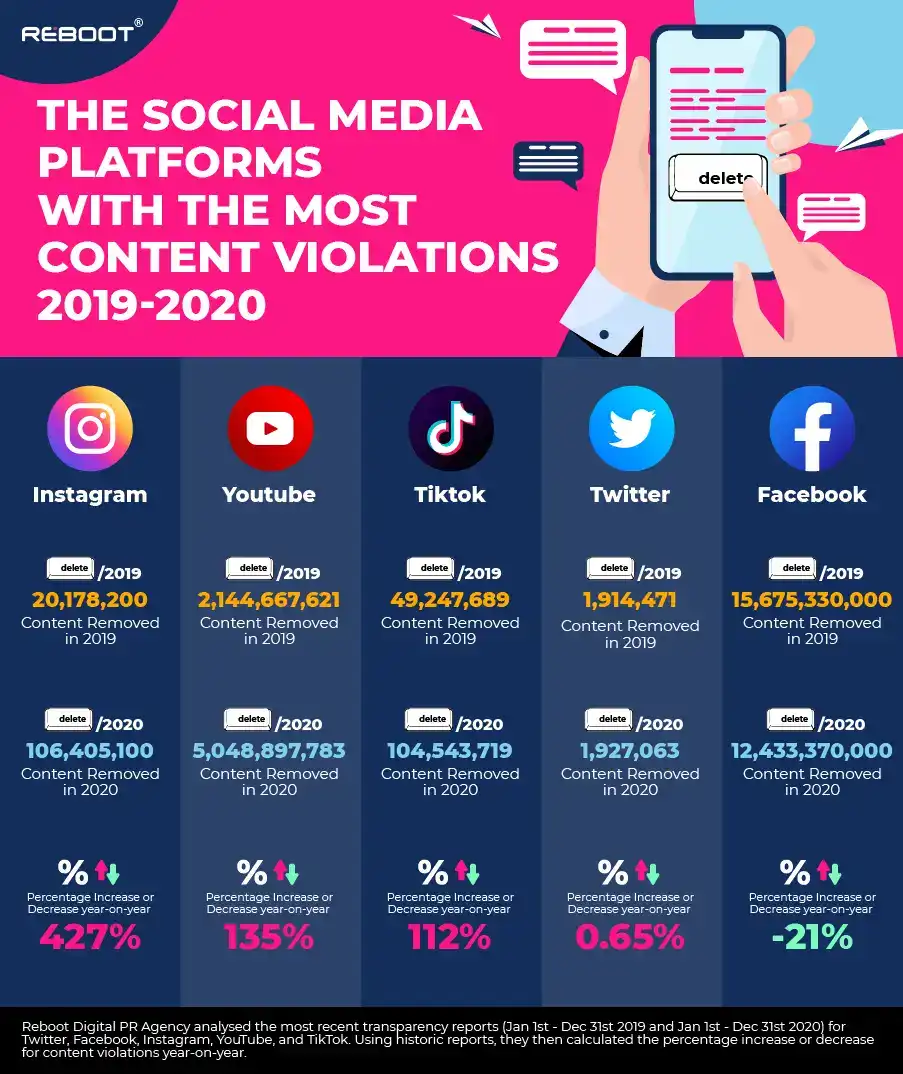
The social media platform with the biggest estimated increase in content removal is Instagram. In this instance, ‘content’ refers to posts and accounts.
Purchased by Facebook in 2012, the photo-sharing platform has increased in popularity over the years and shows no signs of slowing its growth - in fact, at the end of 2020, Instagram surpassed over 1 billion monthly active users*. However, the platform has been subject to a significant amount of content removed, at an approximate increase of 427% since 2019.
YouTube follows in second place, with an increase of 135%, having had comments, videos and even channels entirely removed. In the present golden age of technology, it is now possible for content to be flagged as soon as it is uploaded, and this is often the case for YouTube videos that contain music without proper licensing.
Following in third is TikTok, which is estimated to have had the third biggest increase in content removed from violations (112%). In 2019, nearly 50 million content removals were noted, compared to over 100 million in 2020. Since TikTok is a relatively new platform, this could be a reason for the relatively low increase in content removal.
In fourth place is Twitter, with an increase of just 0.65% of content being removed - in fact, our research found that 12,592 more pieces of content were removed in 2020. However, it was discovered that Facebook was the only social media platform to have an overall decrease in removed content, with more than 3 million less content being removed in 2020 compared to 2019 - a decrease of 21%, or a fifth.
What is the main reason for content removal?
According to our research, copyright is a huge factor in the number of content removals and is expected to continue to rise as influencers grow in popularity. One of the largest reasons for content violation on these platforms is copyright infringement, and examples of this include:
◼ The use of music
◼ Product displays without proper licensing or permission.
Violation breaches, such as these, can not only result in content removal but also demonetisation.
YouTube: Regional breakdown
Included in Google’s transparency report is a country-by-country breakdown of the number of videos removed from YouTube each quarter, dating back to July 2019. We extracted the data for removed videos for the last quarter (Oct-Dec) of 2020 and 2019 and compared the values of removed videos**. From this comparison, we were able to calculate a percentage increase in removed videos during Oct-Dec 2019 and Oct-Dec 2020.
Country |
Removed content in the period Oct-Dec 2020 |
Removed content in the period Oct-Dec 2019 |
Percentage increase of removed content |
|
Saudi Arabia |
136,707 |
42,026 |
225.29% |
|
Turkey |
272,124 |
93,575 |
190.81% |
|
Iraq |
247,472 |
88,377 |
180.02% |
|
Brazil |
865,420 |
331,406 |
161.14% |
|
Bangladesh |
172,835 |
68,445 |
152.52% |
|
Colombia |
77,240 |
31,546 |
144.85% |
|
Singapore |
100,139 |
42,530 |
135.46% |
|
United Kingdom |
116,836 |
49,764 |
134.78% |
|
India |
1,758,094 |
757,130 |
132.21% |
|
Pakistan |
233,576 |
102,943 |
126.90% |
|
Philippines |
193,589 |
85,649 |
126.03% |
|
France |
70,081 |
31,031 |
125.84% |
|
Argentina |
104,318 |
47,010 |
121.91% |
|
Malaysia |
64,487 |
29,571 |
118.08% |
|
South Korea |
121,994 |
62,450 |
95.35% |
|
Mexico |
188,127 |
98,887 |
90.24% |
|
Spain |
57,342 |
31,326 |
83.05% |
|
Egypt |
109,476 |
60,673 |
80.44% |
|
Morocco |
108,973 |
62,698 |
73.81% |
|
Vietnam |
191,732 |
110,923 |
72.80% |
|
Indonesia |
820,786 |
518,373 |
58.34% |
|
United Arab Emirates |
51,937 |
34,241 |
51.68% |
|
Thailand |
92,320 |
61,152 |
50.97% |
|
Peru |
52,383 |
42,516 |
23.21% |
|
Ukraine |
89,824 |
73,187 |
22.73% |
|
Germany |
101,738 |
88,946 |
14.38% |
|
Japan |
49,180 |
46,275 |
6.28% |
|
United States |
1,148,976 |
1,100,337 |
4.42% |
|
Russia |
294,929 |
282,721 |
4.32% |
Saudi Arabia is the country with the largest percentage increase in content removal, at 225%, with Turkey in second place (190%), and Iraq in third (180%).
The United Kingdom ranks eighth, with an increase in content removal of 134.78%.
Third from the bottom is Japan, at 6%, whilst the United States and Russia are the countries with the smallest percentage increase in content removal, at only 4%.
Conclusions
One conclusion from this analysis is that social media platforms are increasingly getting better at removing content, as well as users that violate their terms of service. By publicising this data, they are showing their commitment to data sharing and safeguarding.
Methodology
* Data from sproutsocial.com
** Last quarters were used to keep consistency as historic data was not available prior to July 2019.
- Reboot Digital PR Agency analysed the relevant transparency reports for Twitter, Facebook (including Instagram), YouTube (via Google), and TikTok.
- Using historic reports, they calculated the percentage increase or decrease in data available from the two most recent reporting periods between Jan 1st – Dec 31st, 2019 and Jan 1st, 2020 – Dec 31st 2020. For Twitter, Jan - June 2019 was compared with the Jan - June 2020 report only since July - Dec 2020 has not yet been released.
- These calculations are an approximation only of the data presented in the reports, and does not account for restored or appealed content, or data not yet released.
- Percentages were rounded to the nearest whole number, barring Facebook.
- Historic transparency report data was not available for Snapchat.