THE GREAT UK RAW SEWAGE SCANDAL
In England and Wales, raw sewage is being dumped on beaches and in rivers on a daily basis through storm overflows, leaving the UK ranking 25th out of 30 European countries for bathing water quality. We've compiled a range of raw sewage statistics to showcase just how bad the issue really is.

Our Analysis of Raw Sewage Dumping in the UK
Recycling sewage has long been an economical way to reduce water resource pressures. However, this comes with the caveat that bacteria must be removed before it’s safe for humans.
Despite this, raw sewage is being dumped into England and Wales’ waterways, resulting in E. coli (EC) and Intestinal Enterococci (IE) traces in our bathing waters.
To get to the bottom of just how bad this issue is, we conducted an analysis of over 16,000 sites — combining historical bathing water quality samples and gridded precipitation observations collected from the Environment Agency and the Met Office.
Some of the metrics we analysed include:

Bathing Water Quality Statistics
To be deemed excellent, good, sufficient, or poor quality, bathing waters must hit a certain level of EC and IE present.
Coast bathing waters
(95th percentile, cfu/100ml):
Inland bathing waters
(95th percentile, cfu/100ml):
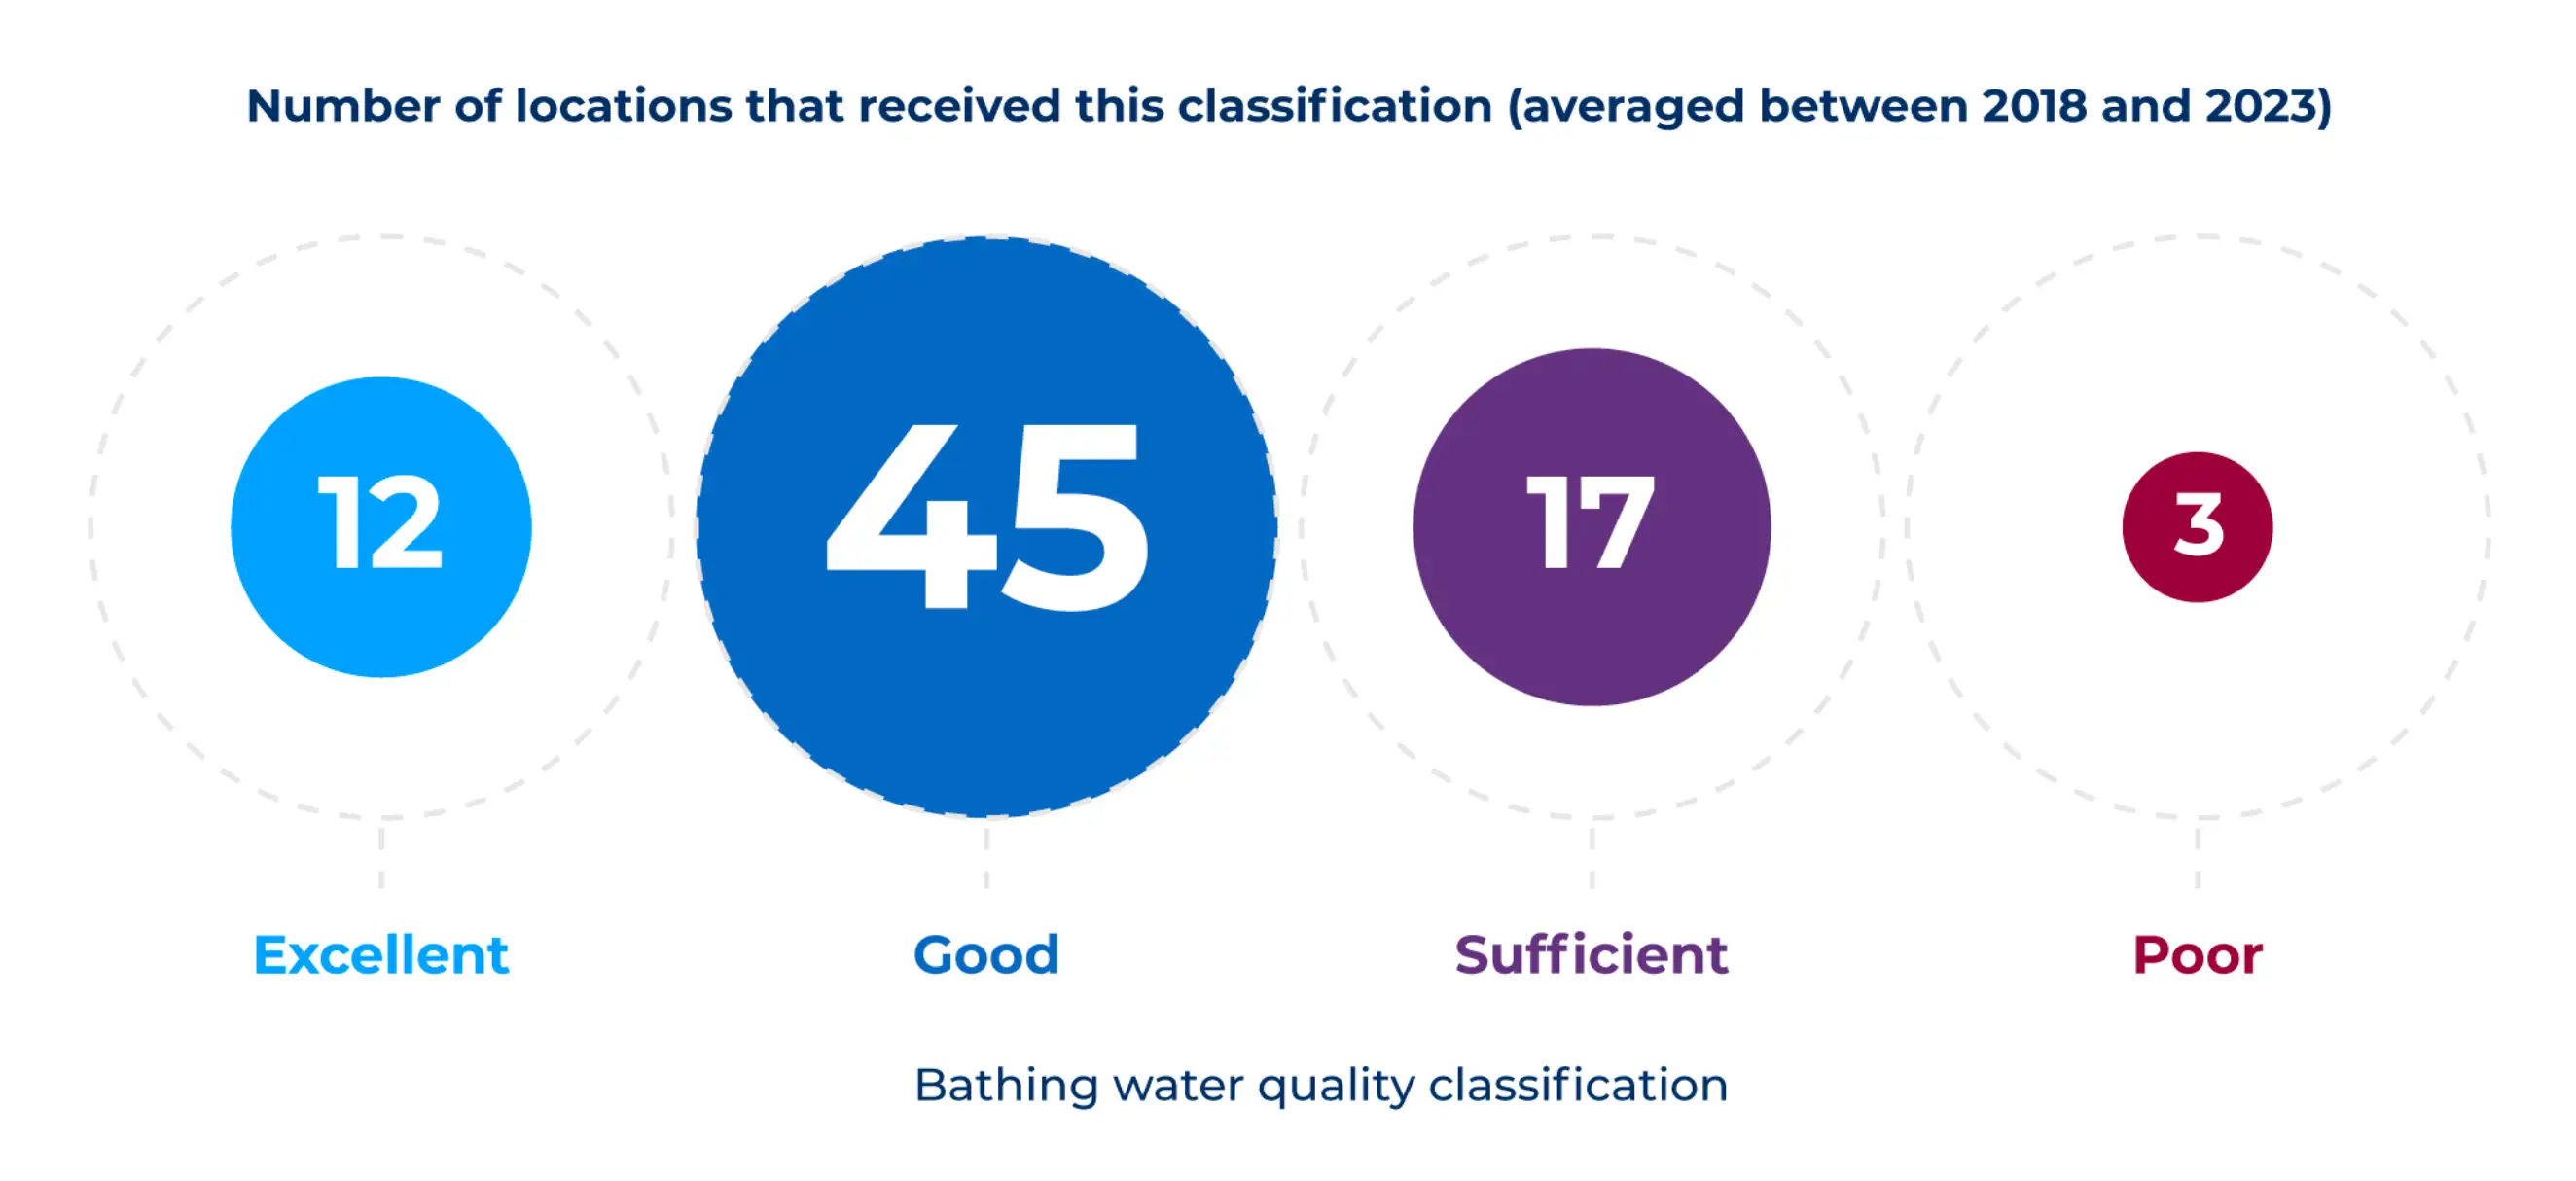
Between 2018 and 2023, the most common classification for inland and coastal bathing waters throughout England and Wales was ‘good’, equating to just over 58%. Only 16% (12 locations) were deemed to be ‘excellent’.
However, more than a quarter (26%) of locations studied throughout England and Wales held a classification of ‘sufficient’ or ‘poor — gross!
Is the Number of Faecal Organisms in Bathing Waters Rising?
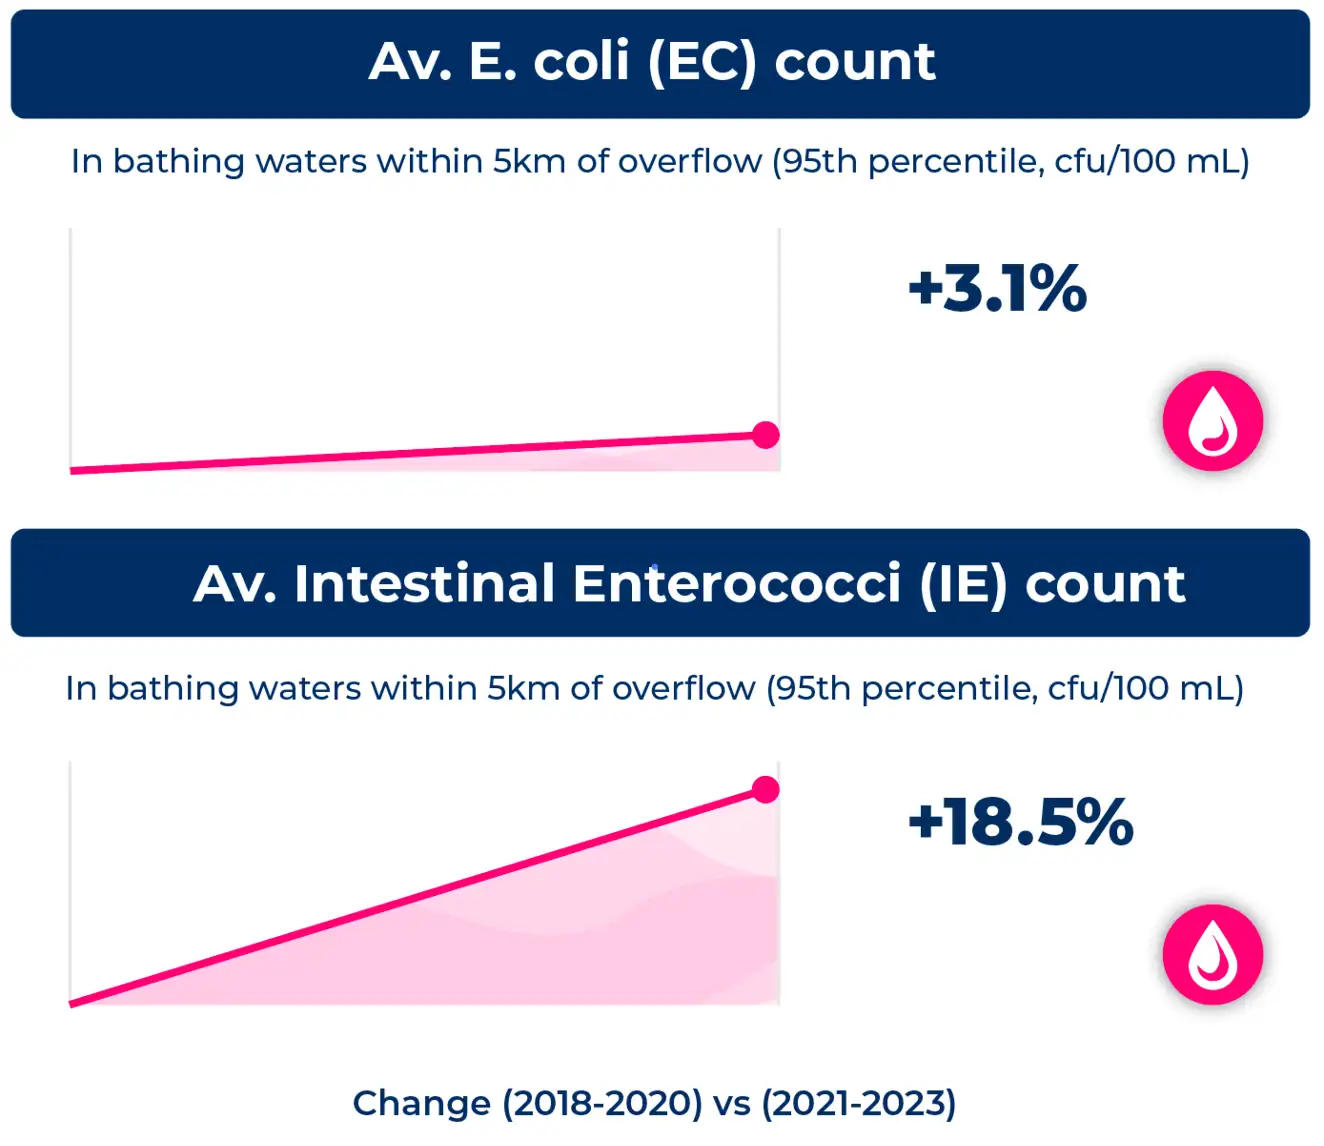
Overall, we can see that the average levels of EC and IE in our bathing waters are rising.
When there was an 18.5% increase in IE found in waters within 5km of a raw sewage discharge site. In the same period, the average EC count also grew by 3.1%.
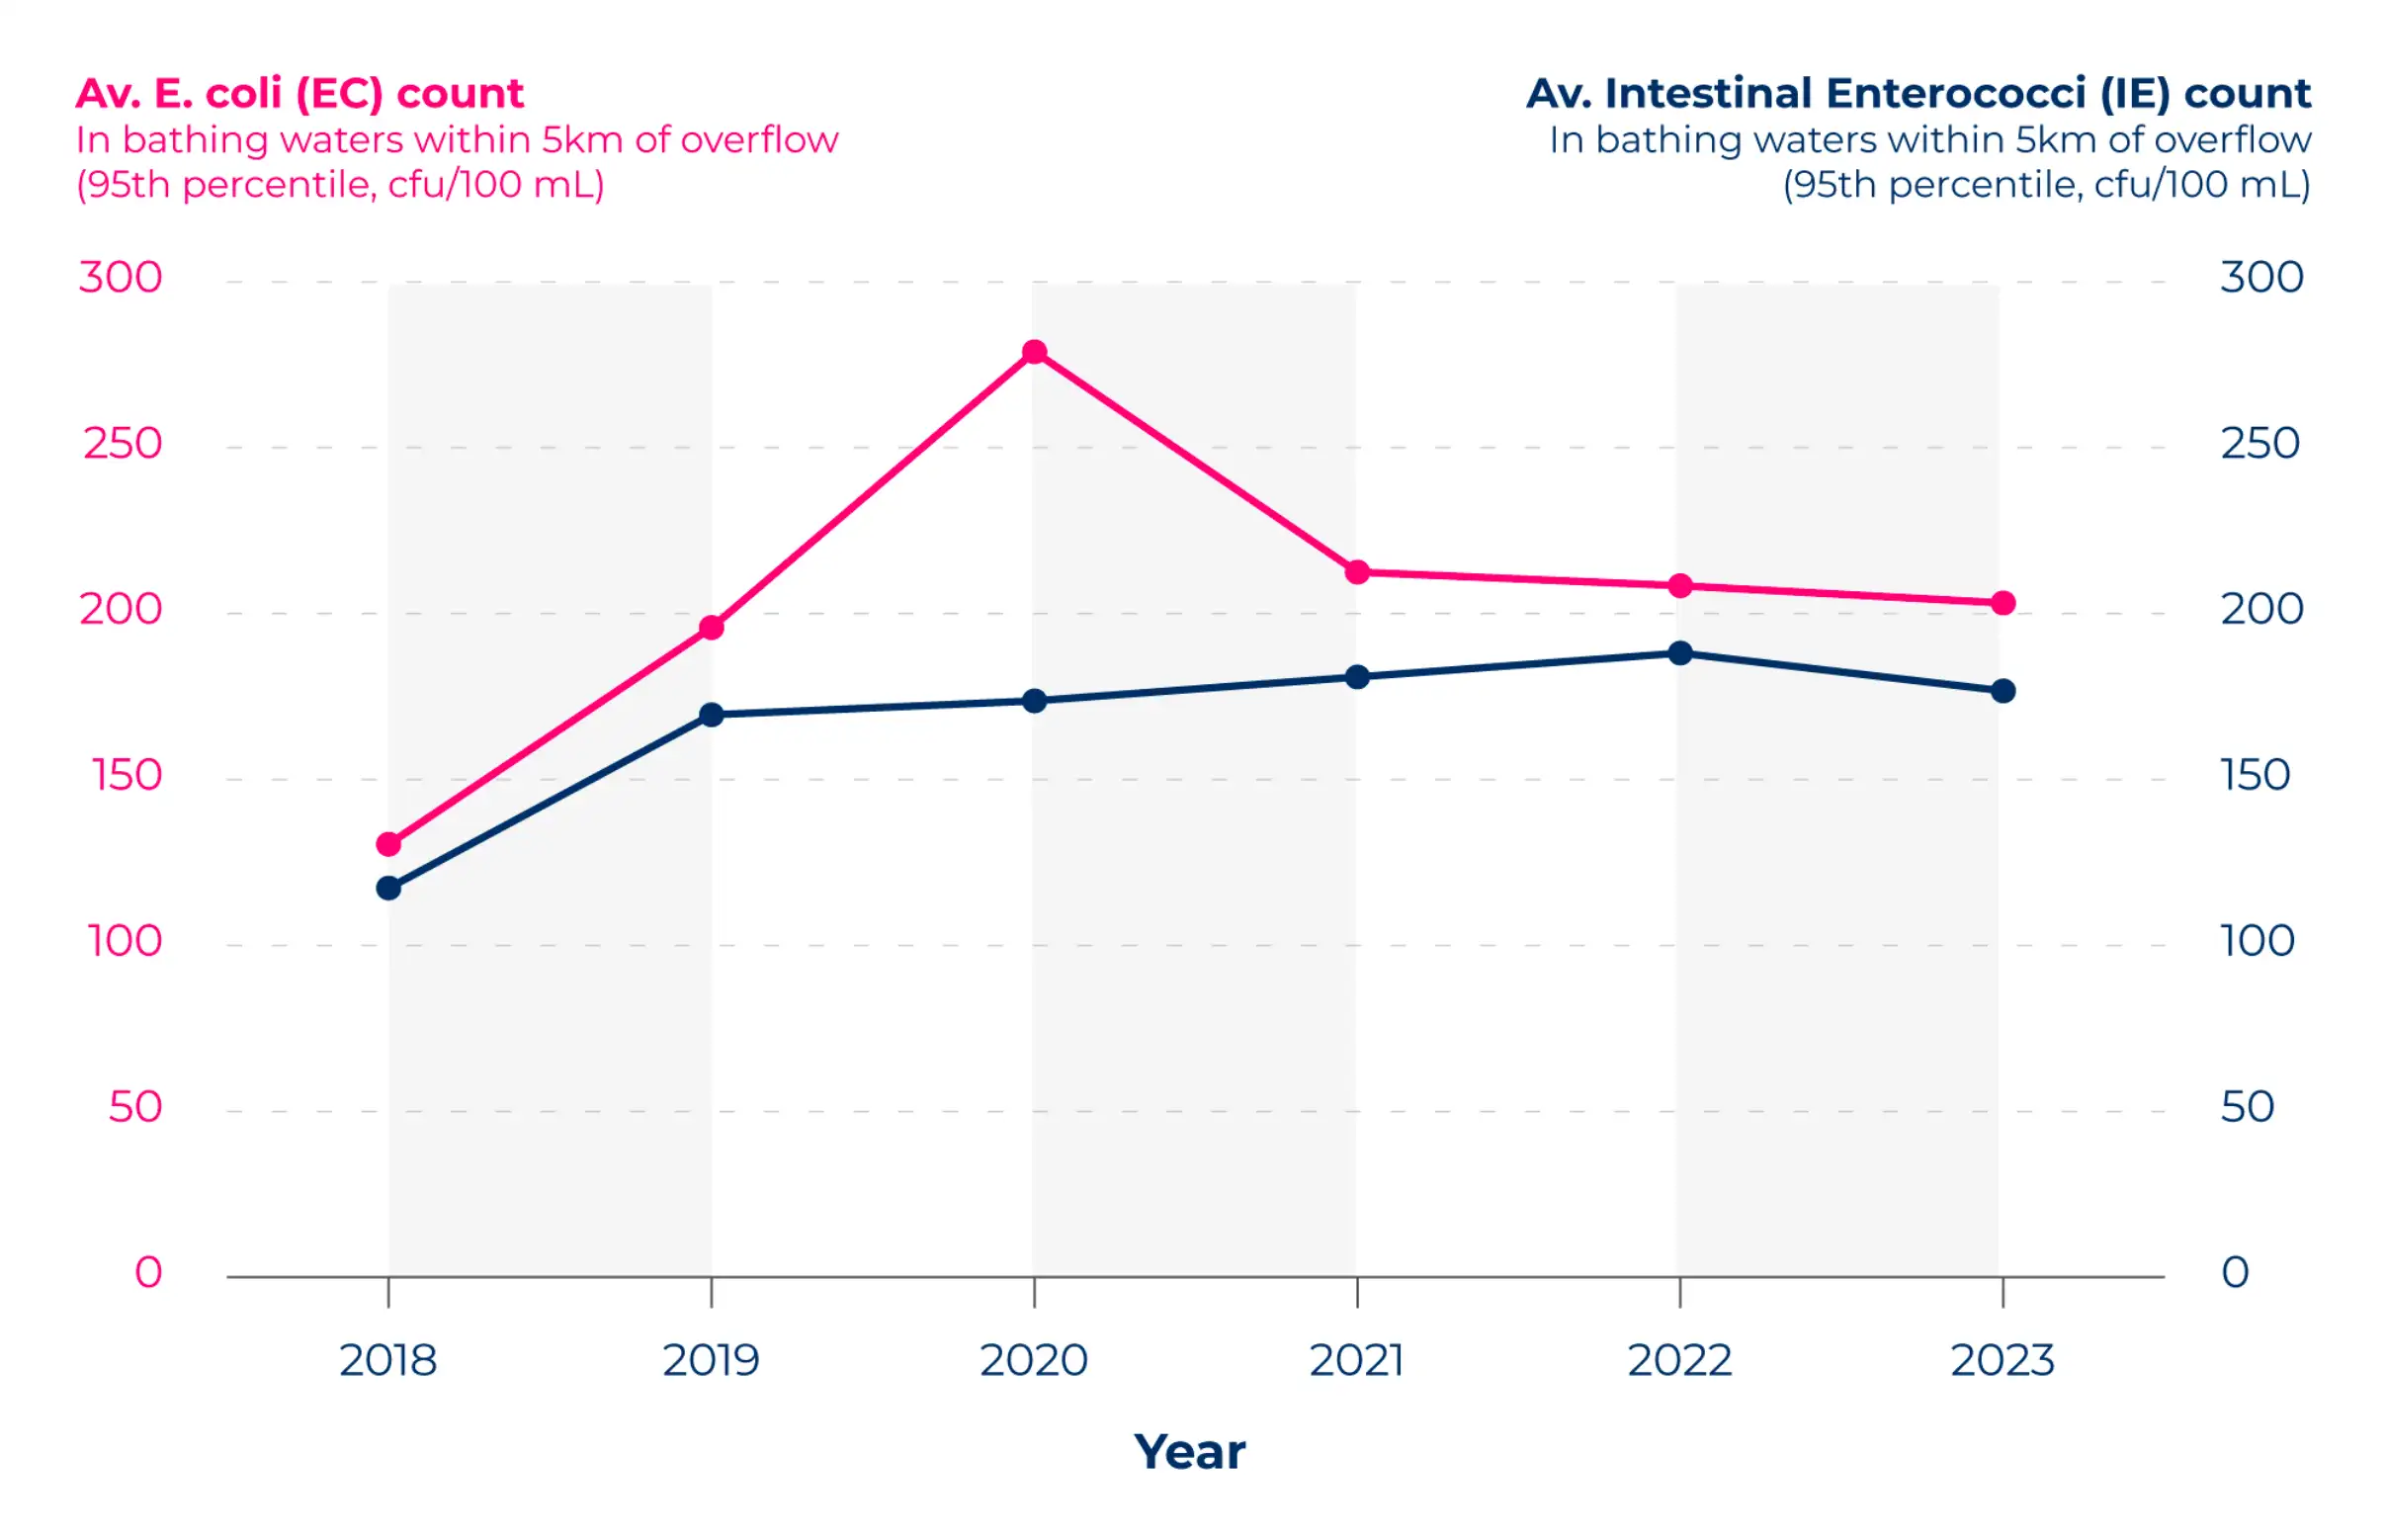
Analysis of overflow sites shows EC spiked in 2020 with an average count of 278.9. This was followed by three years of decreasing numbers, with 2023 figures sitting at 203.2 — a reduction of just over a quarter (27%).
IE escalated yearly through to 2022 before dipping in 2023,
IE escalated yearly through to 2022 before dipping in 2023, signalling growing sewage discharge and health hazards in bathing waters over the five-year period. The biggest jump happened between 2018 and 2019 when the count increased by more than two-fifths (44.5%).
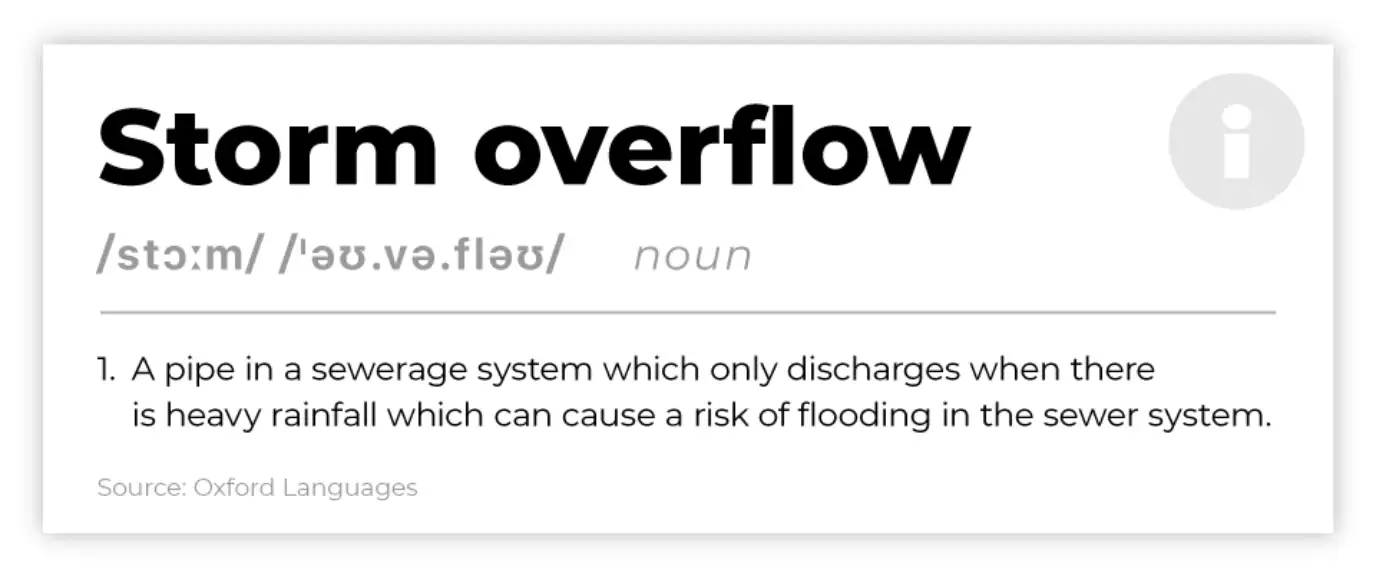
How Many Raw Sewage Spills Are There Each Year in England and Wales?
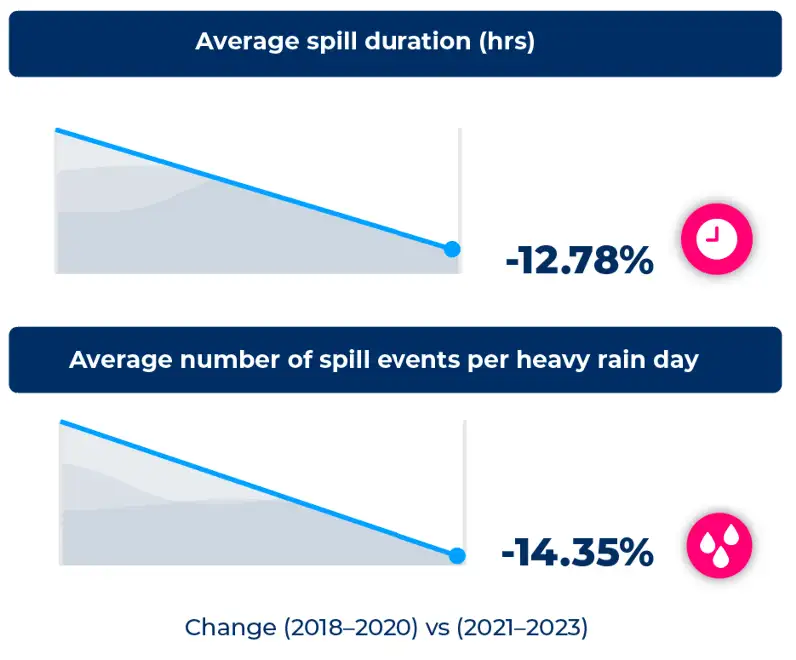

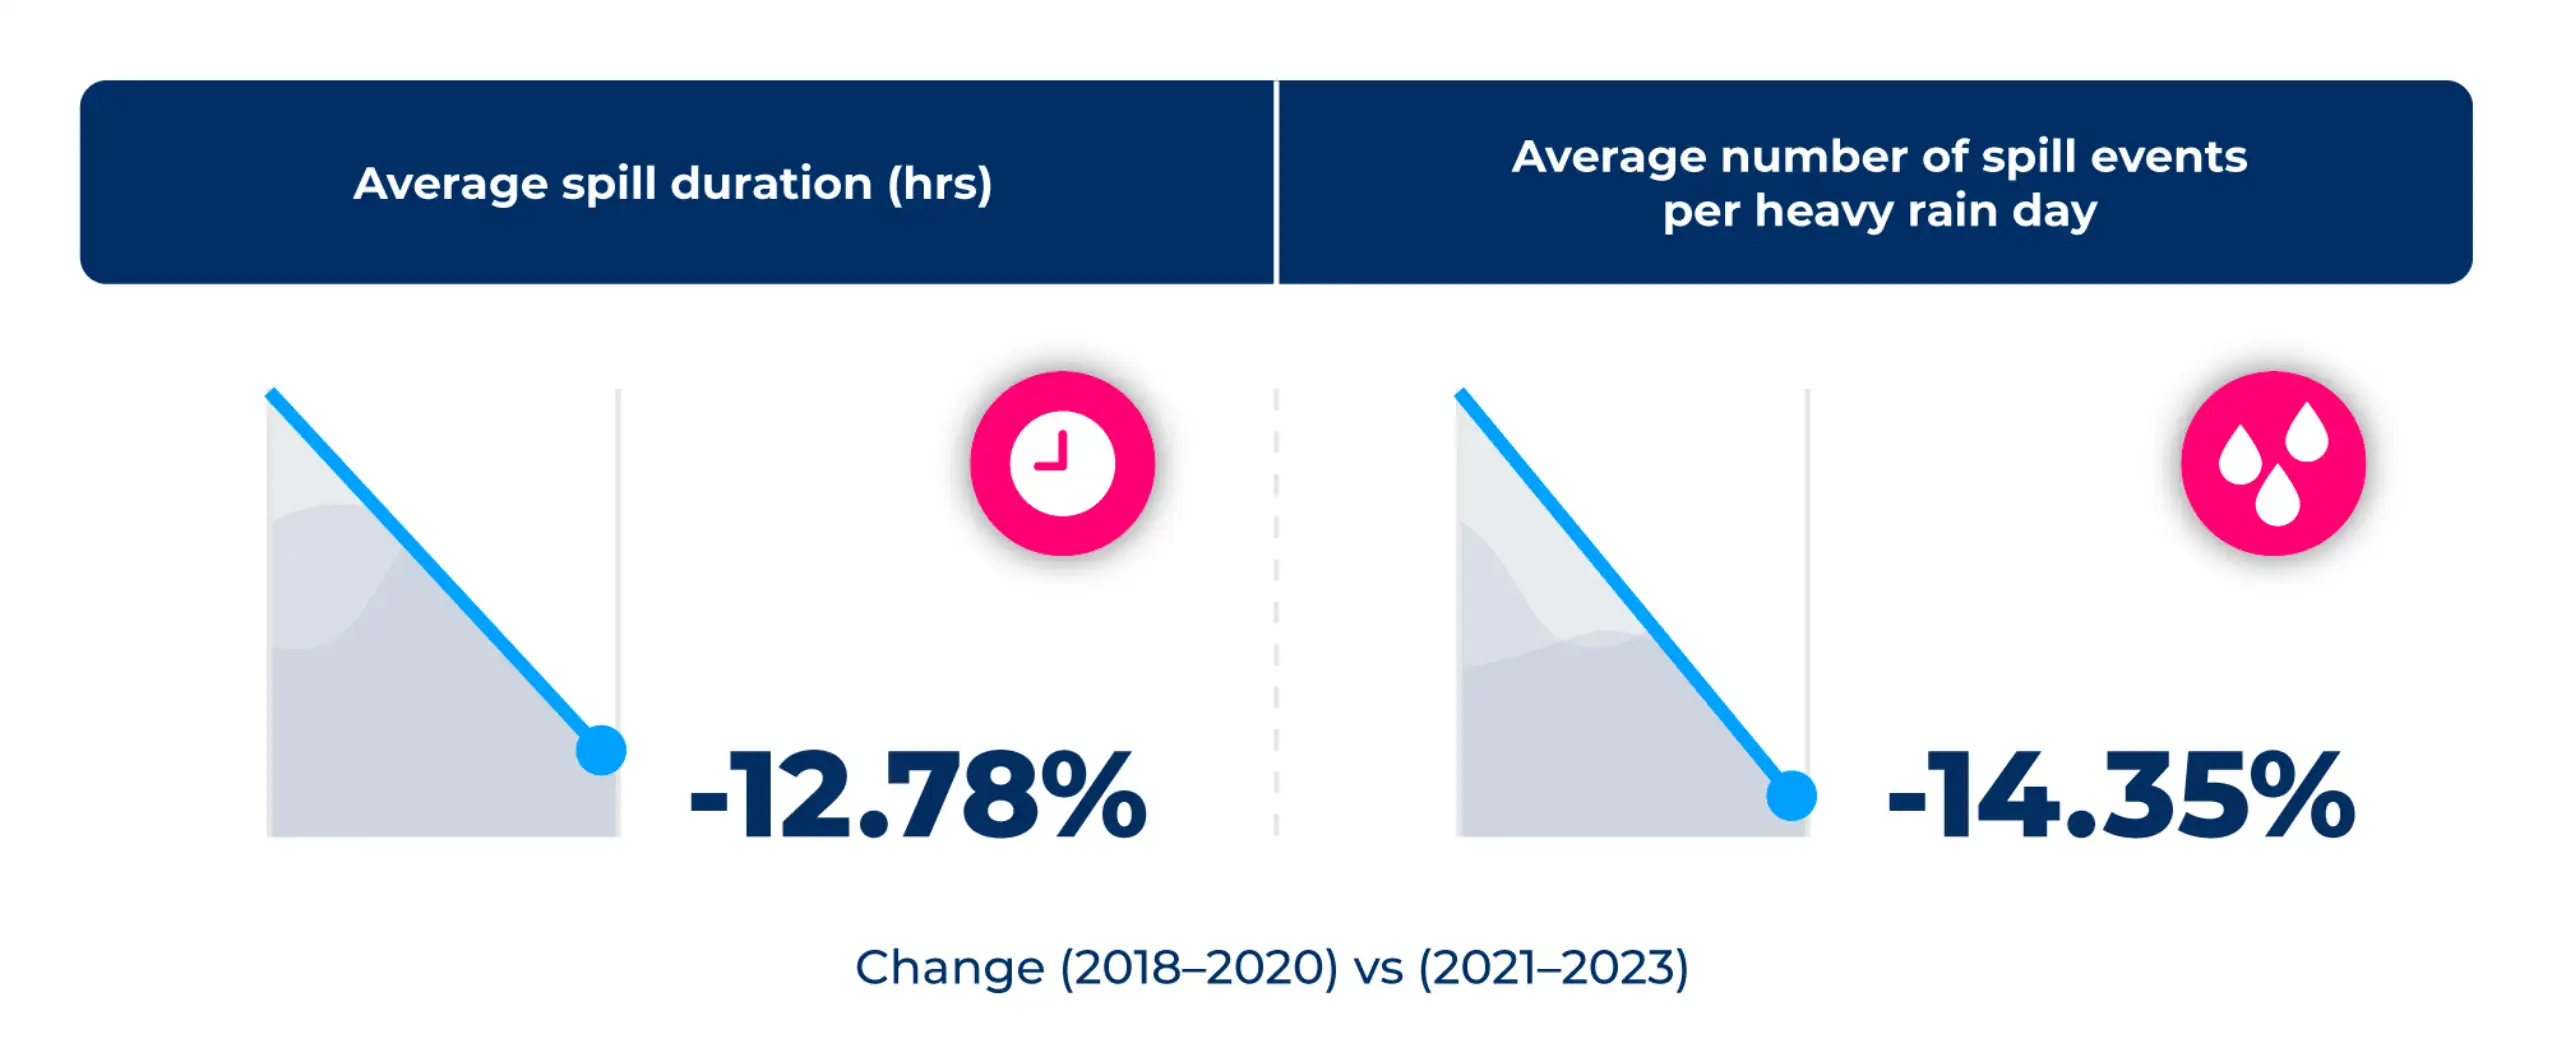
To find the cause of increased faecal organisms in our waterways, we analysed data on the average duration of sewage spills and the average number of spills per heavy rain day.
However, our analysis indicates these figures are declining. Comparing 2018-2020 to 2021-2023, there was a 12.78% decrease in the average sewage spill duration and a 14.35% reduction in sewage spills per heavy rainfall day.
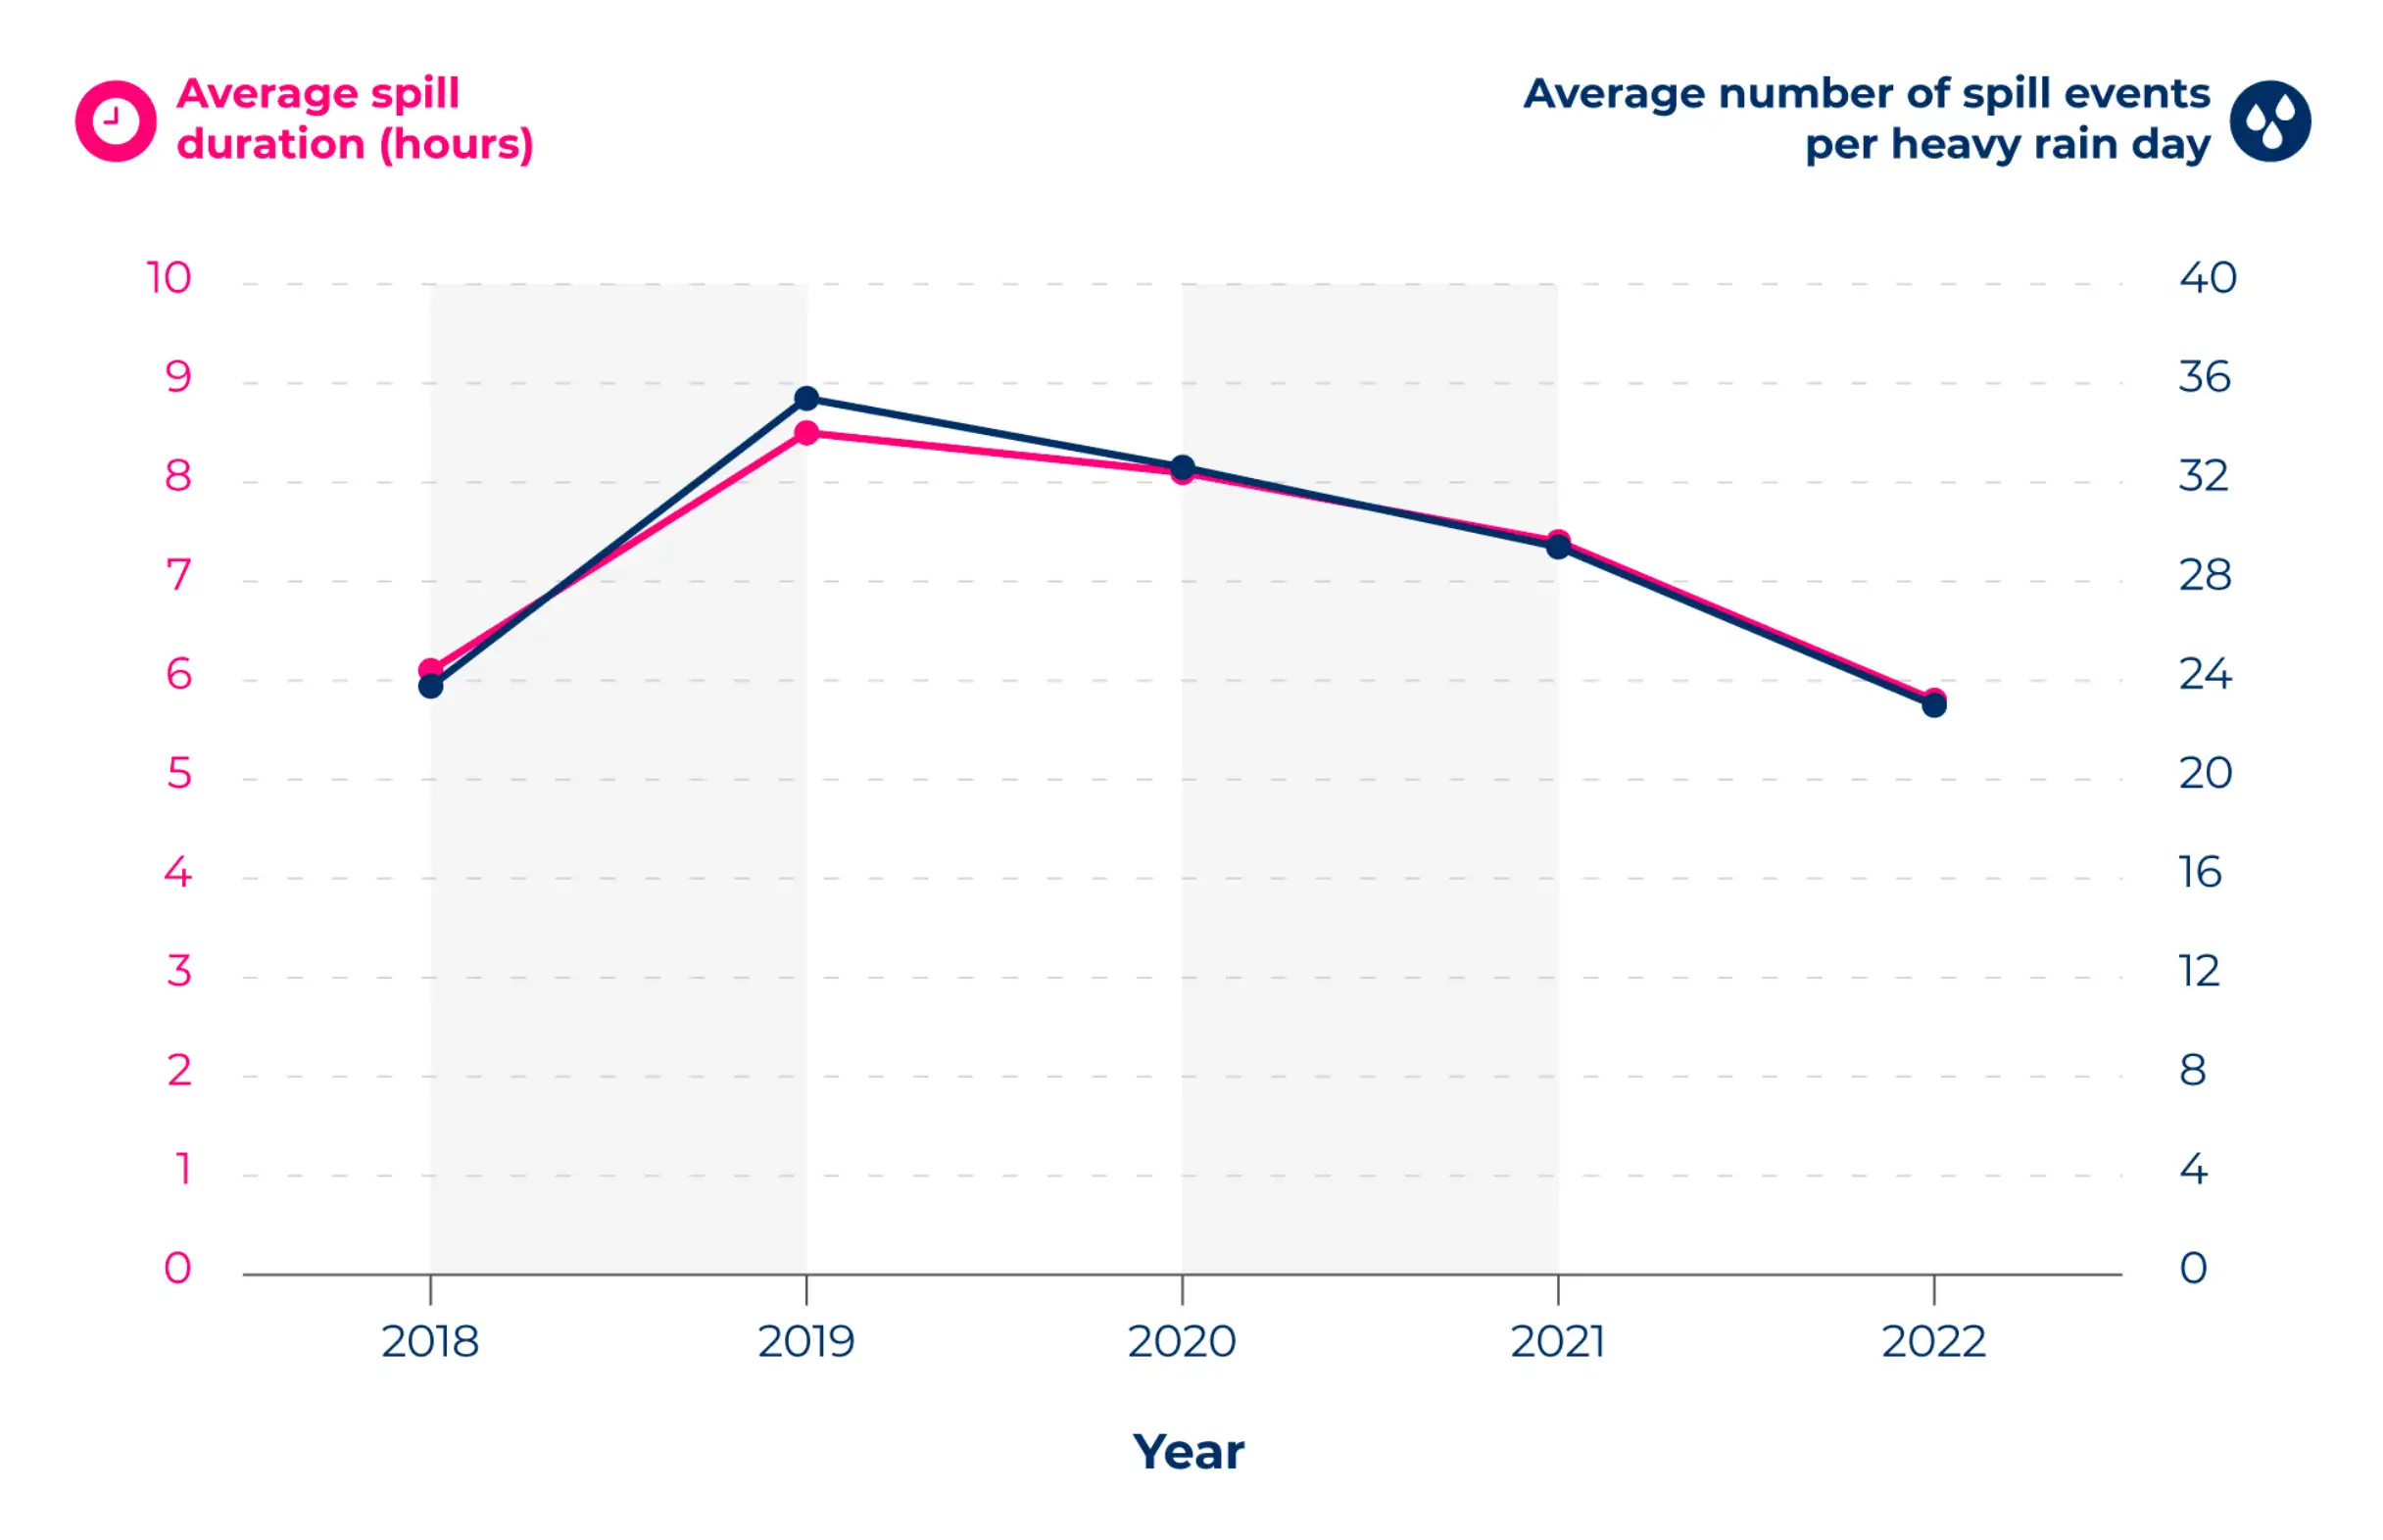
The data shows the average duration of sewage spills peaked at 8.5 hours in 2019, before declining annually to 5.8 hours in 2022. This marked an almost 32% overall drop between these years.
Similarly, the average spill events occurring per rainy day reached 35.39 in 2019, but decreased to 23 in 2022 — a 35%, three-year reduction.
10 Places Where the Bathing Water Quality is Getting Worse

After analysing the change in average annual EC and IE counts between 2018–20 and 2021–23, we were able to attribute a normalised bathing water quality degradation score out of 100 to each local authority.
A HIGHER SCORE SHOWS THE PLACES WHERE THE WATER QUALITY IS GETTING WORSE.
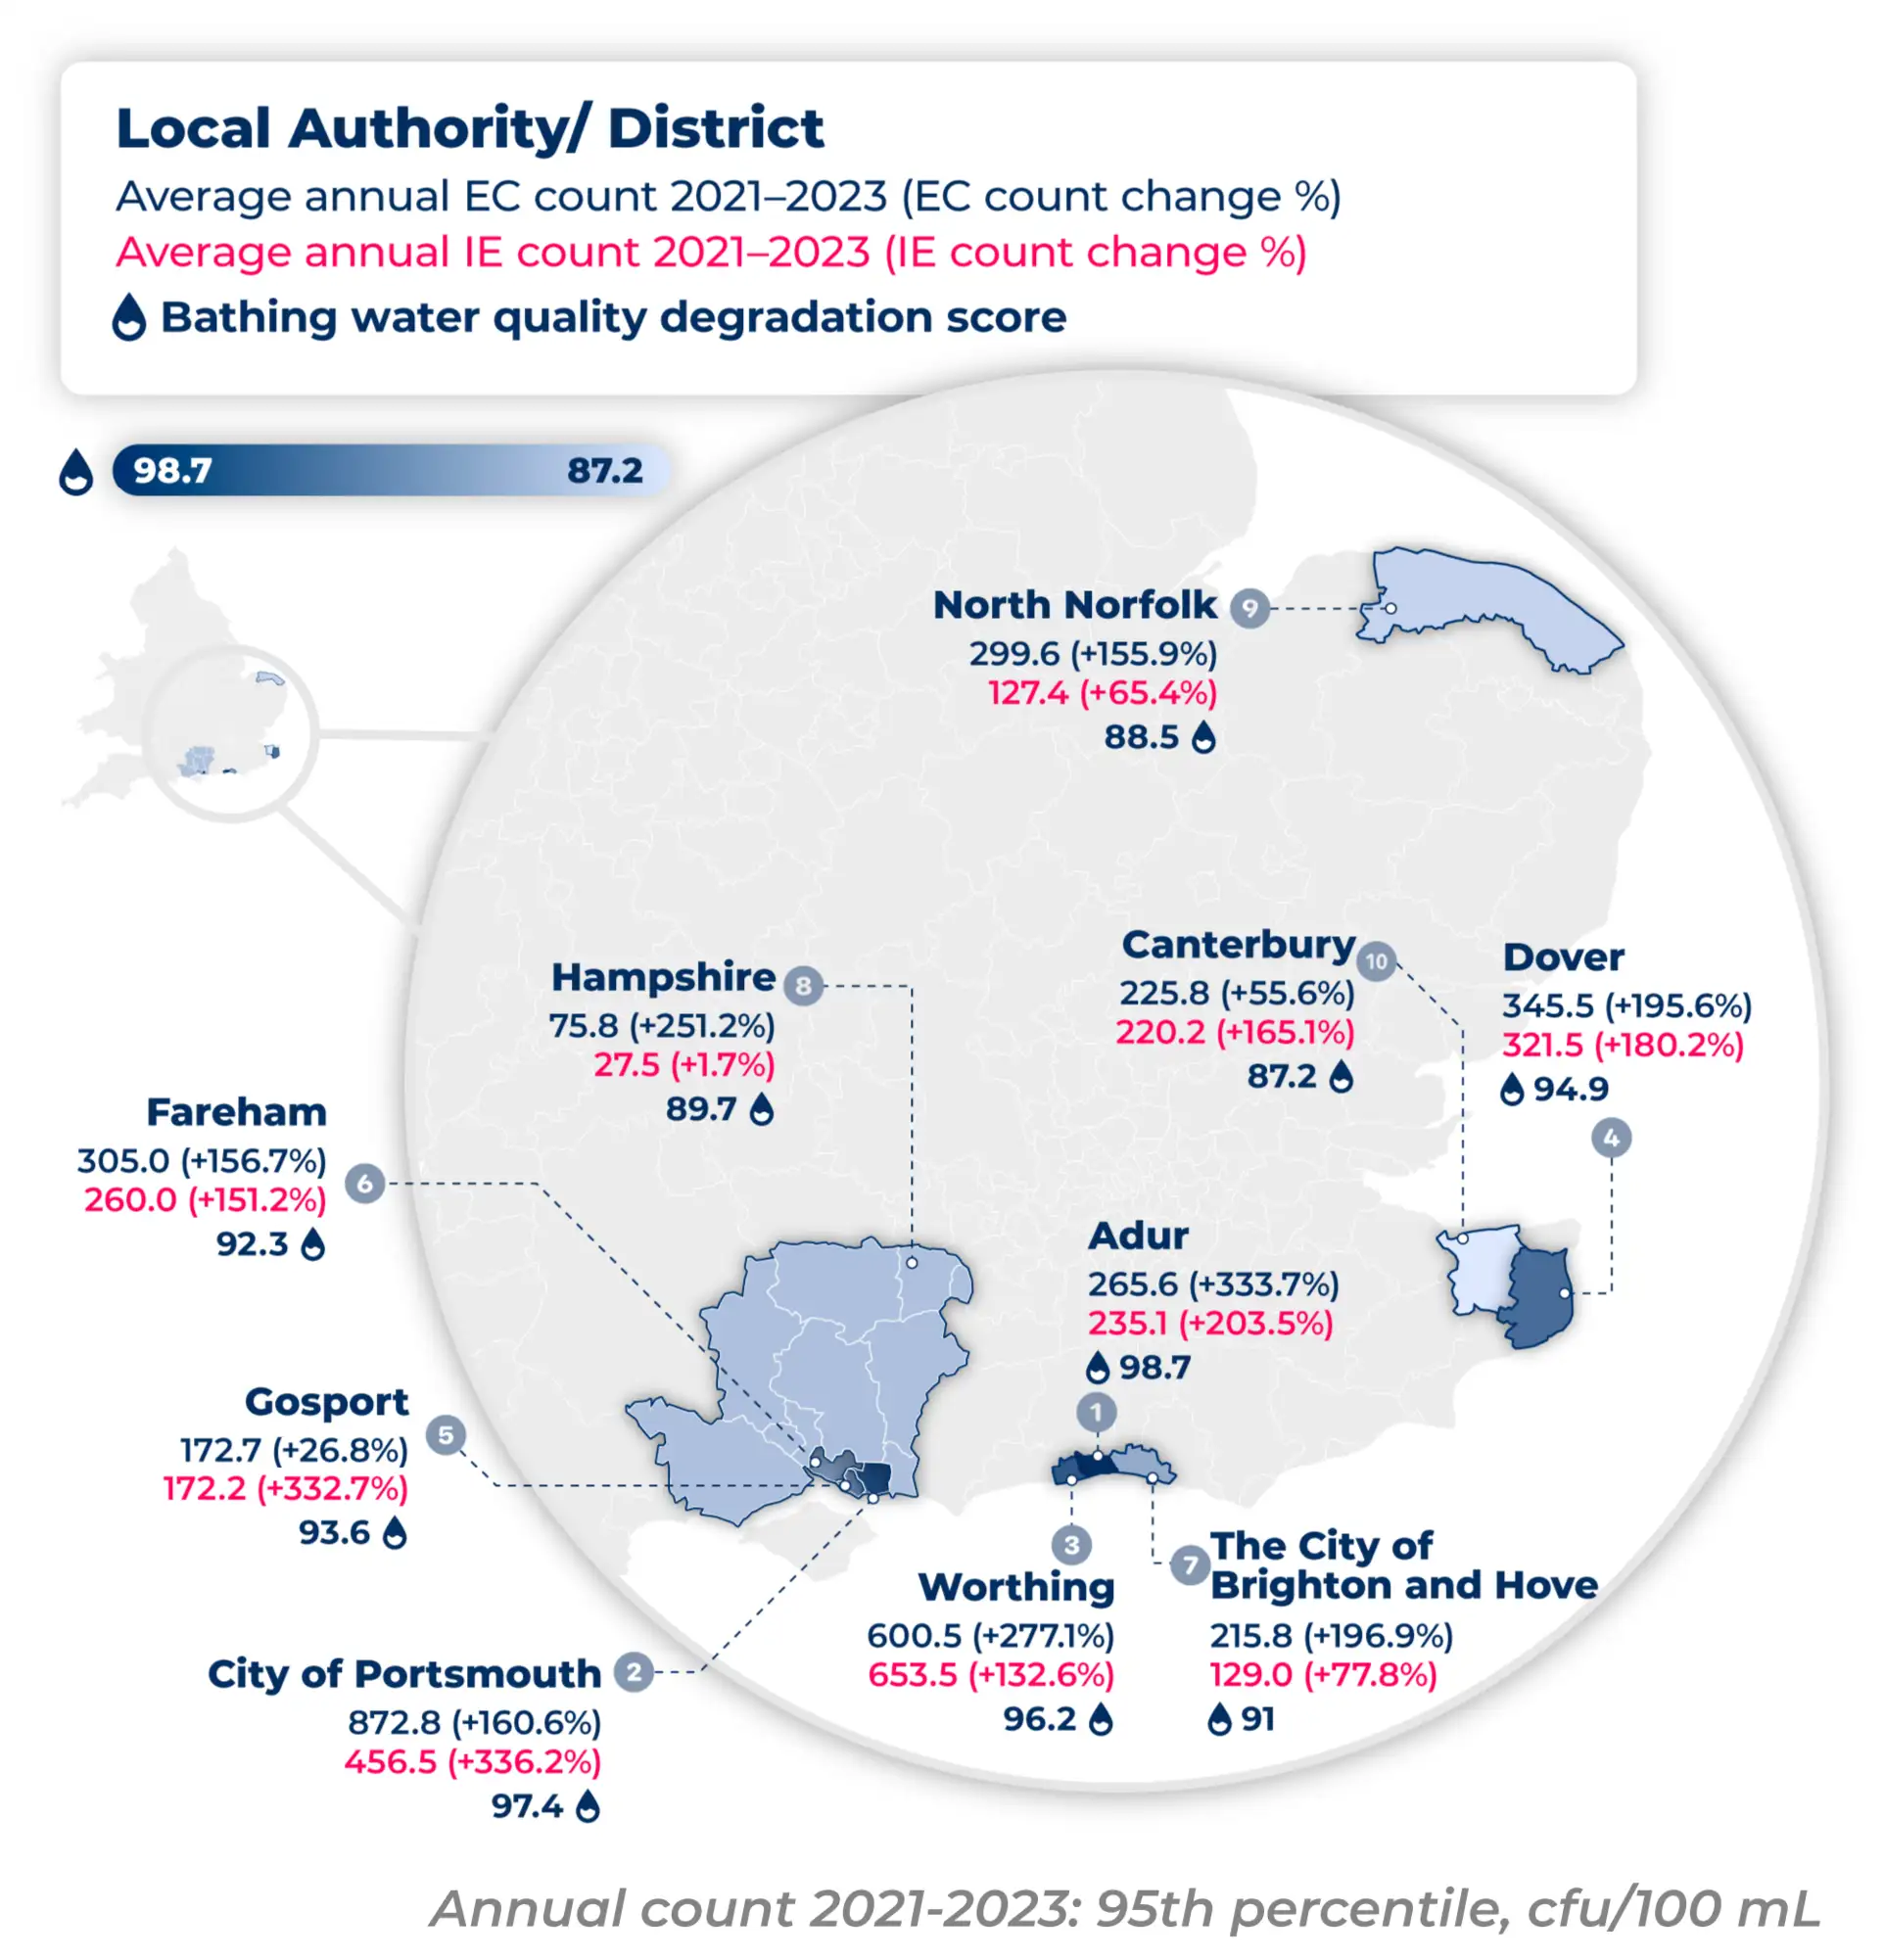
The top 10 spots in England and Wales for water quality degradation are dominated by locations in the South East — taking up 90% of the rankings.
Adur recorded drastic EC increases of 333.7% and 160.6%, respectively, when comparing 2018–2020 levels with 2021–2023. IE counts also jumped in this area, going from an average of 77.5 to 235.1 (+203.5%). This means this location has a water degradation score of 98.7 out of 100.
Portsmouth recorded the highest increase of IE out of all of the local authorities in the top 10. In fact, +336.2% was the
Portsmouth recorded the highest increase of IE out of all of the local authorities in the top 10. In fact, +336.2% was the biggest increase between 2018–20 and 2021–23 when looking at both types of faecal organisms. This is followed by the growth of EC in Adur within the same time period, which is 2.5% lower at +333.7%.
The only location in the top 10 outside of the South East is North Norfolk, found in the East of England. The district saw respective rises of 155.9% and 65.4% in EC and IE. Though less drastic than its southern counterparts, this region’s water quality still worsened over a relatively short timeframe, giving it a bathing water quality degradation score of 88.5.
10 Places Where the Bathing Water Quality is Getting Better

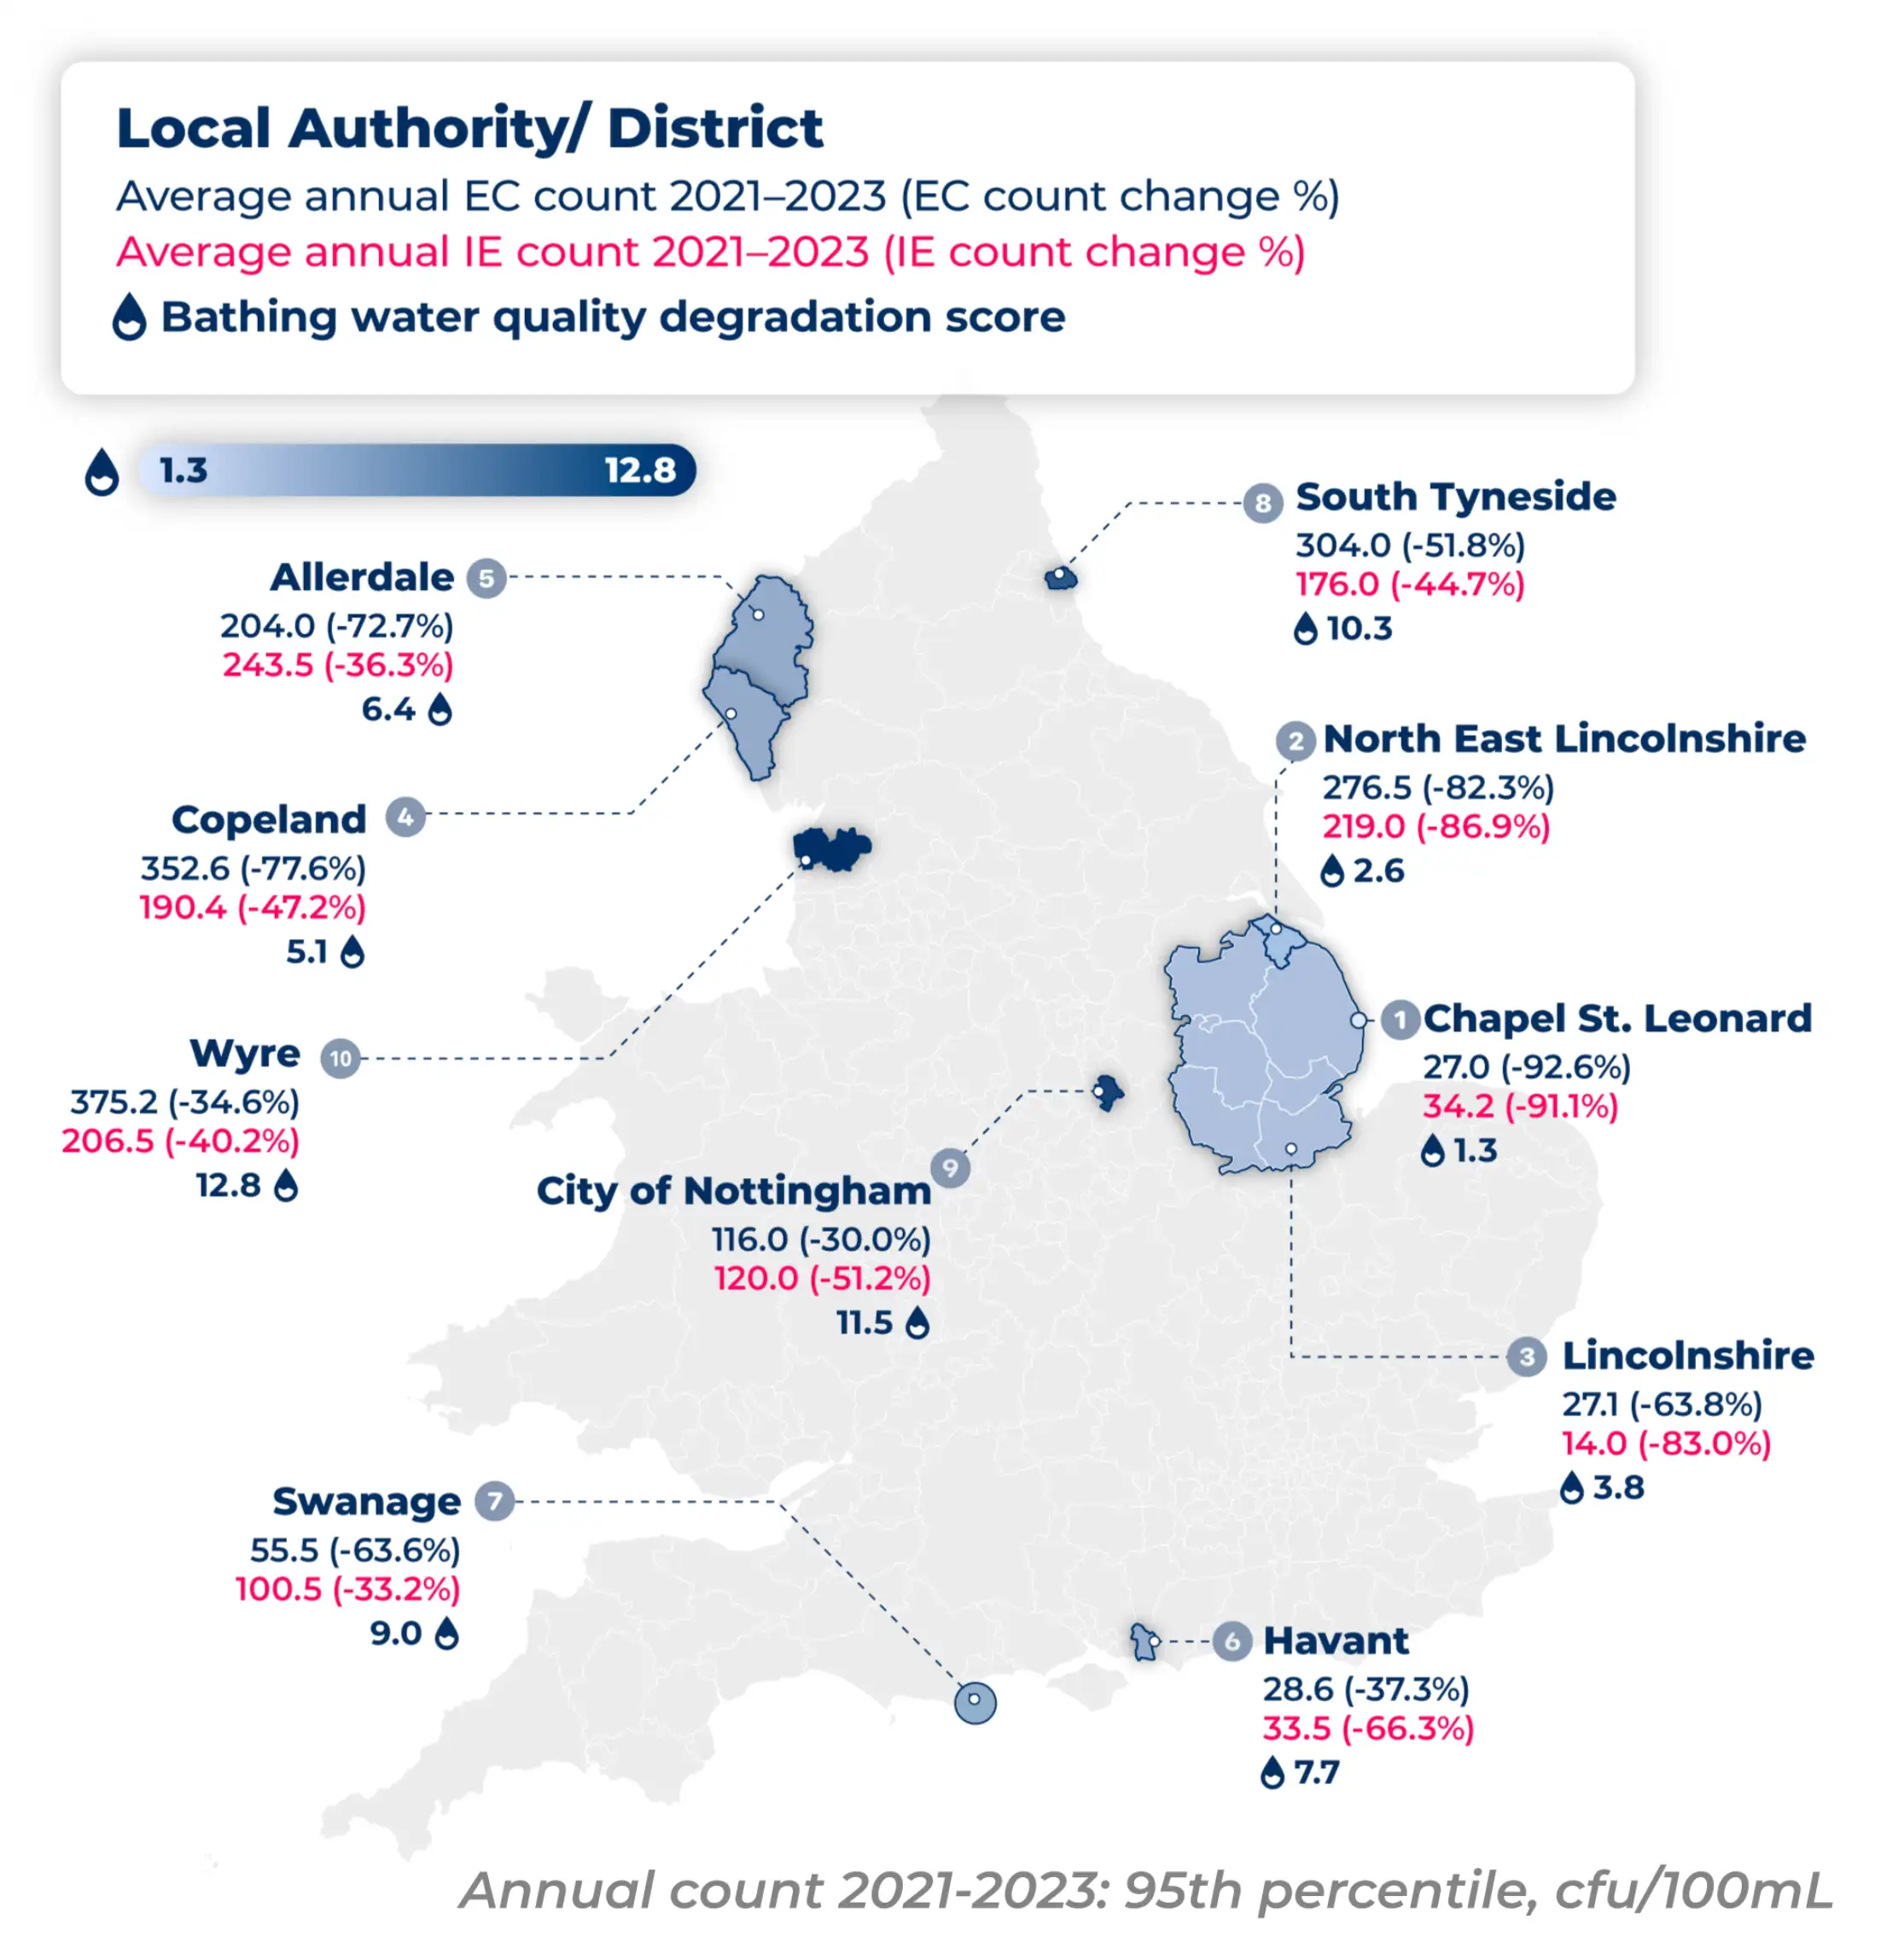
Several spots across England and Wales showed promise when it comes to water quality degradation, especially one region in particular. The top three locations where water quality has improved the most between 2018–20 and 2021–23 are all based in Lincolnshire. In the top spot is Chapel St. Leonards, where EC reduced by 92.6% while IE lessened by 91.1%.
North East Lincolnshire also saw enormous drops in both EC and IE, exceeding 80% in the same period.
North East Lincolnshire also saw enormous drops in both EC and IE, exceeding 80% in the same period. This reduction in faecal organisms gives this location a water quality degradation score of 2.6 out of 100.
Encouraging trends emerged farther north too. The North West’s Copeland and Allerdale districts experienced considerable EC count declines surpassing 70%. The EC count in Copeland’s waterways sat at 1,573.5 between 2018 and 2020, but this dropped to 352.6 in 2021 to 2023.
Find Out Your Location’s Bathing Water Degradation Score

Where in the UK Has There Been the Most Raw Sewage Discharges?
While many areas showed deteriorating or improving water quality, looking at total sewage discharge figures across England and Wales provides a comprehensive perspective on the scale of the pollution issue.
By evaluating key metrics like number of spills and cumulative hours of releases across all monitored overflow sites from 2018-2023, we can see the areas worst hit by raw sewage dumping.
The 10 Places with the Highest Number of Raw Sewage Spill Hours in England and Wales
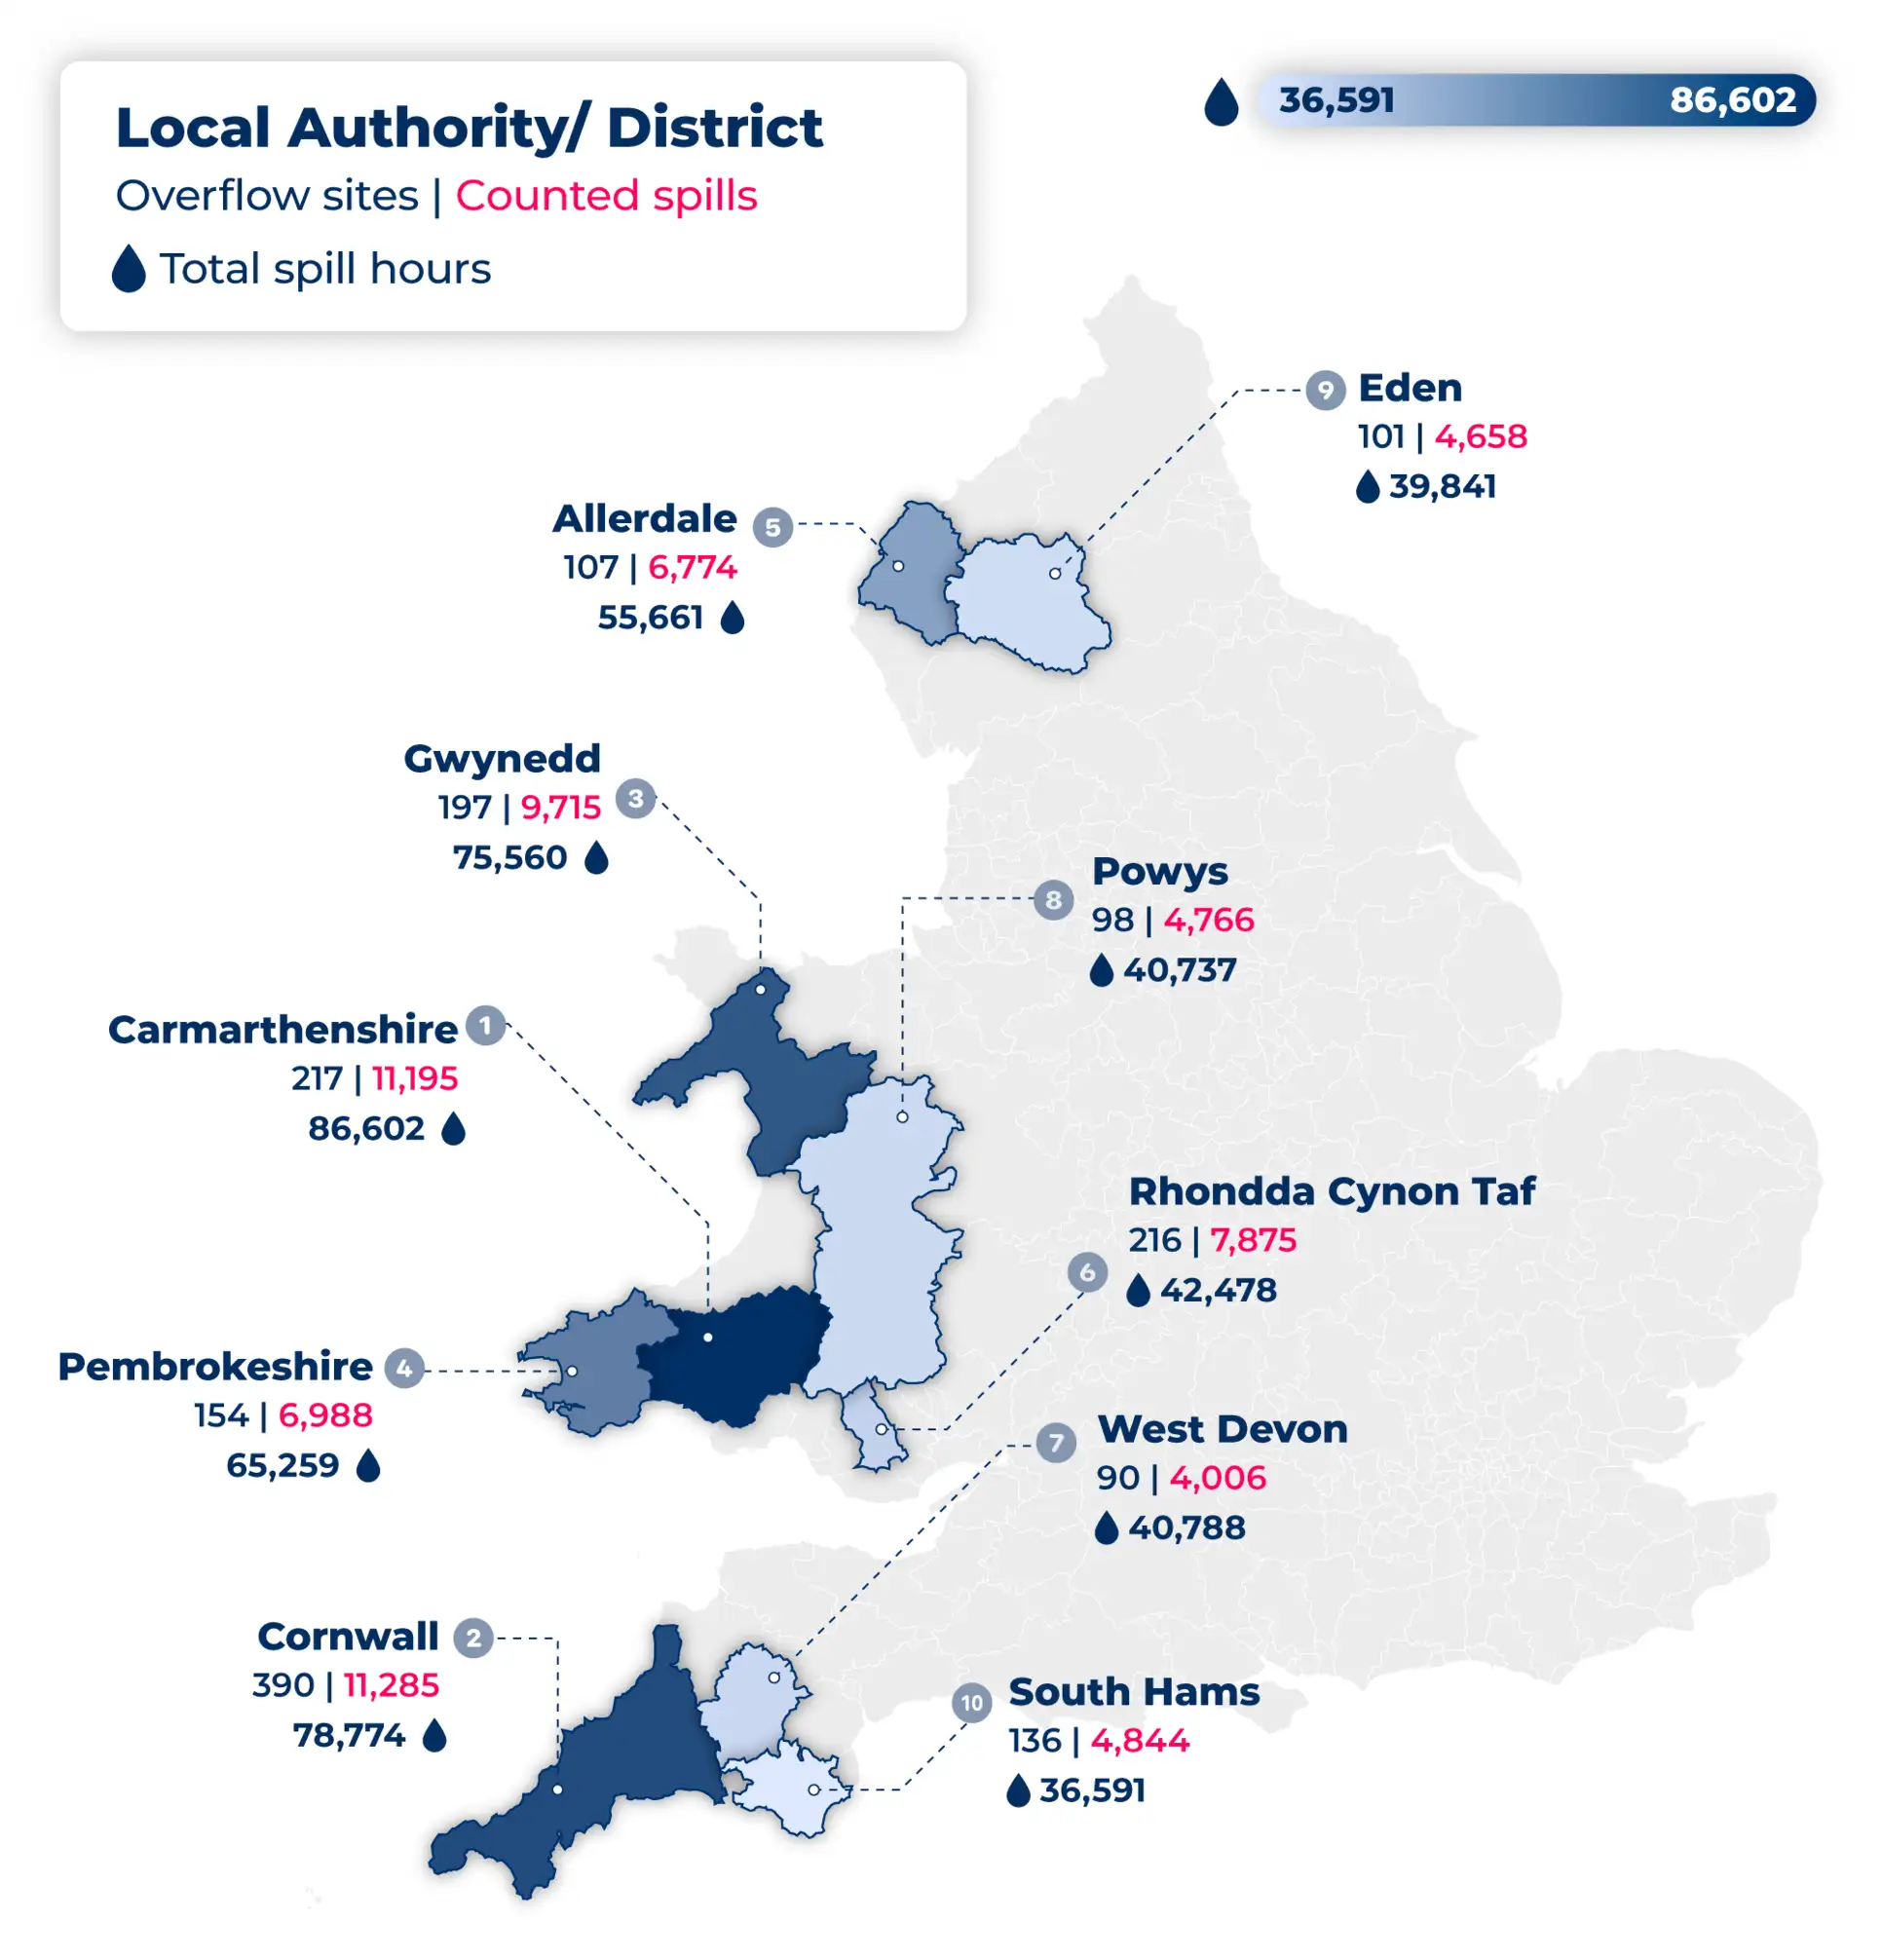
Wales experienced widespread issues with sewage overflows between 2018 and 2023. Carmarthenshire logged the most spill hours during this period at over 86,602 hours, and also recorded 11,195 total spillages from 217 sewage dumping sites. Neighbouring locations Gwynedd and Pembrokeshire saw 75,560 and 65,259 hours, respectively, despite fewer sites, indicating more prolonged but concentrated spills.
The South West also faced considerable volumes of sewage discharge, with locations in Cornwall and Devon
The South West also faced considerable volumes of sewage discharge, with locations in Cornwall and Devon ranking second, seventh, and tenth for total hours. Cornwall registered 11,285 spills amounting to nearly 77,774 hours, while South Hams and West Devon registered 77,379 hours combined.
Northern regions were not immune either. There were 55,661 hours of sewage spilling across 107 sites in Allerdale. This is over a third (33%) more than the other North West location in the top 10, Eden, which recorded 36,591 hours of raw sewage discharge in the UK from 2018 to 2023.
Find Out How Many Sewage Spills Have Happened in Your Location

Which Water Company has Recorded the Most Raw Sewage Spills?
Water company comparisons
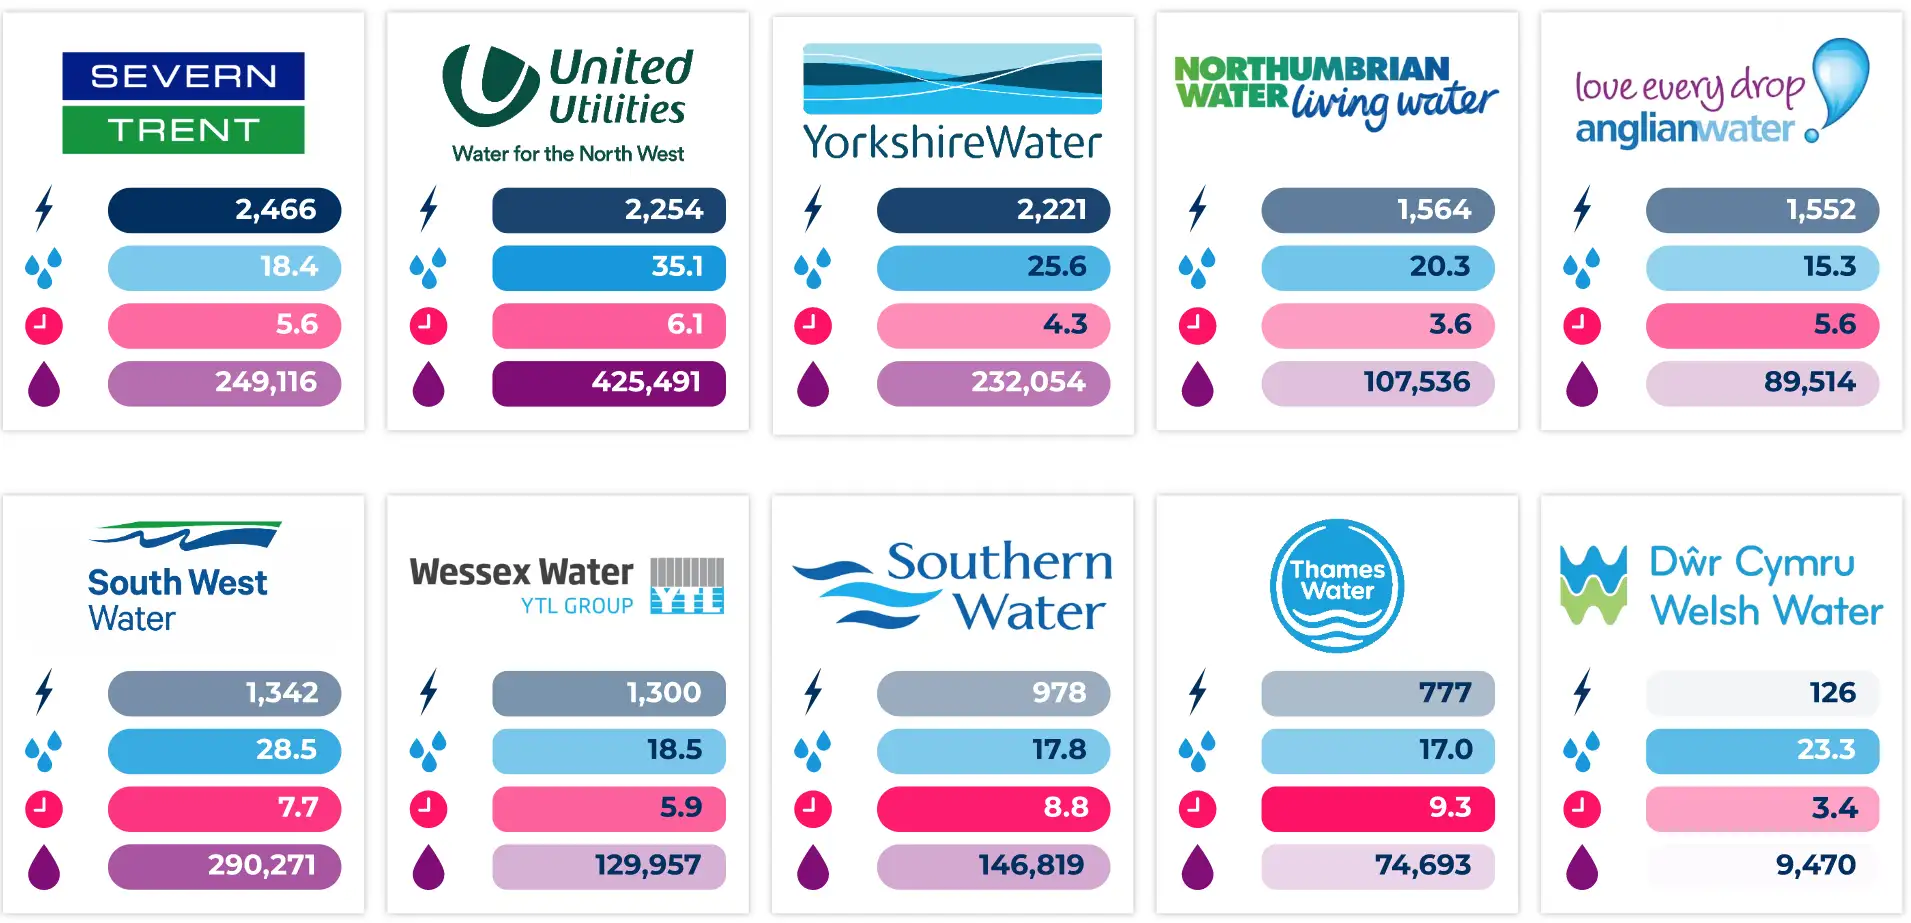
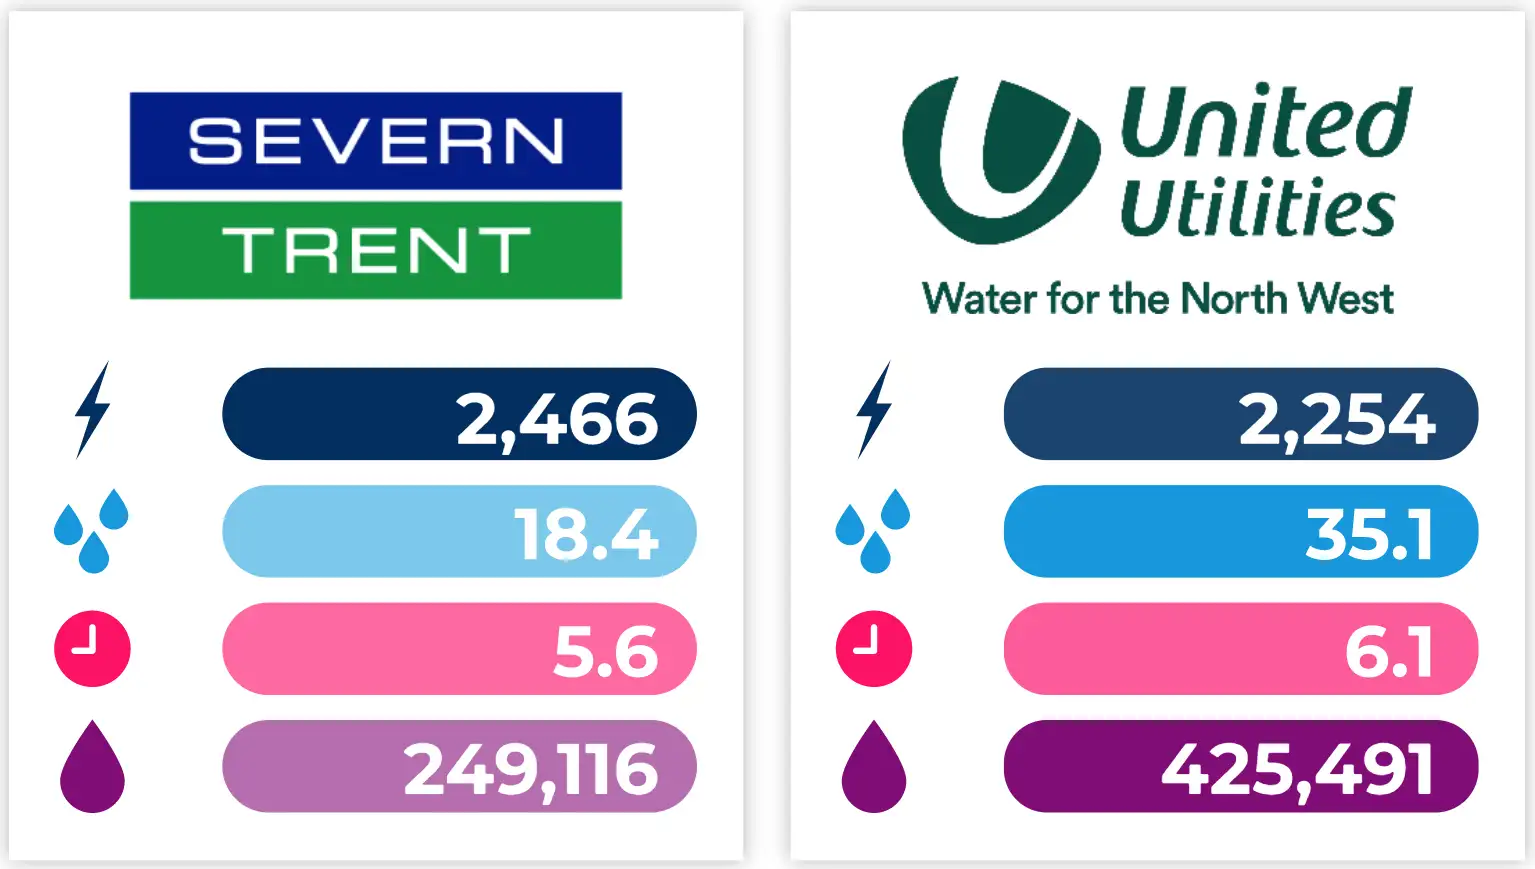
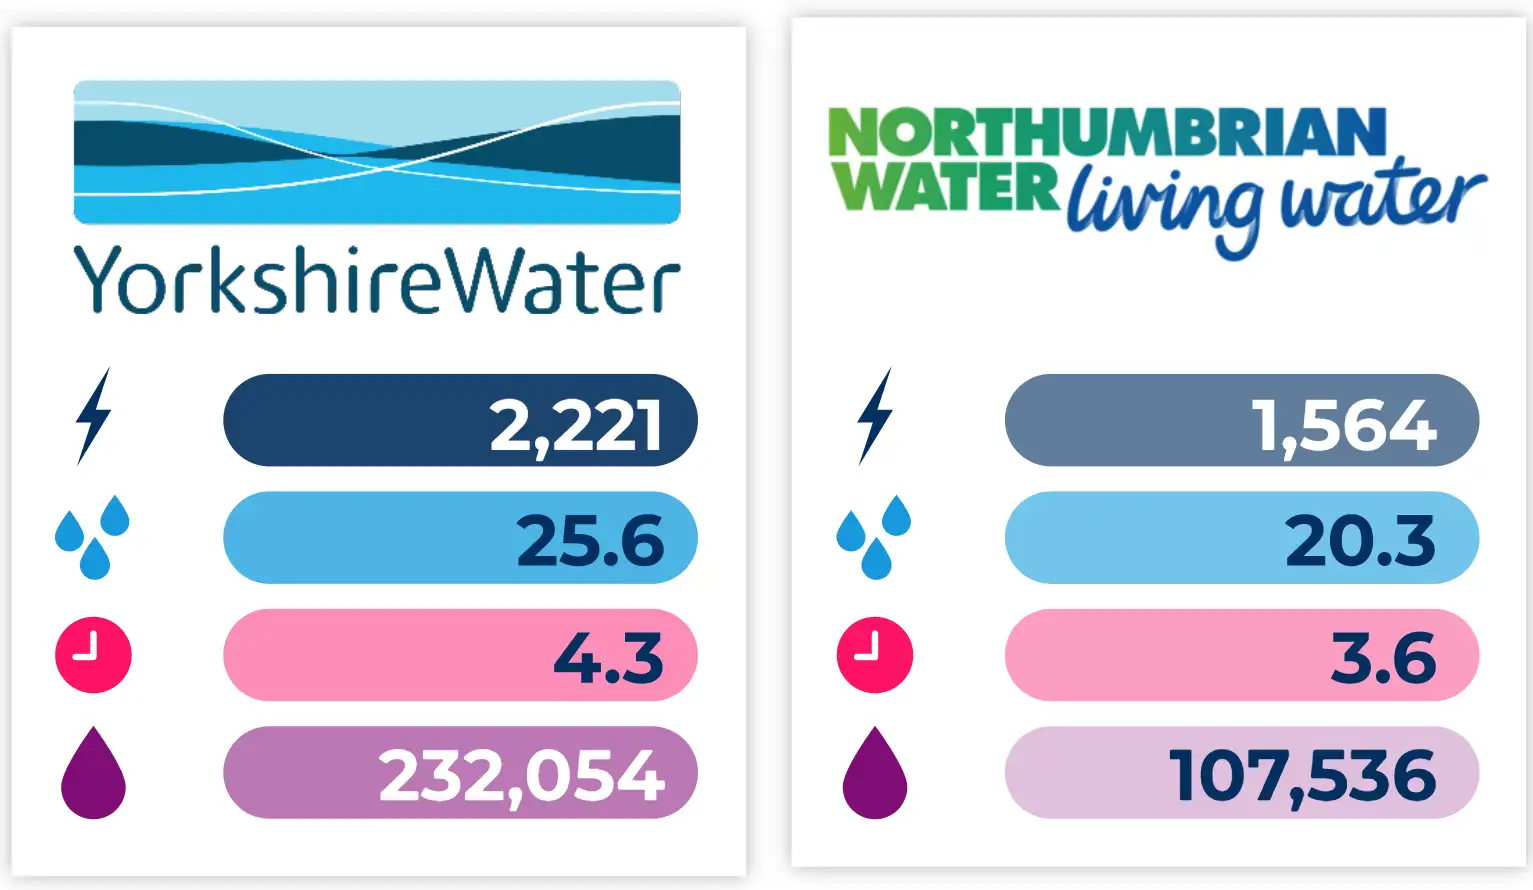
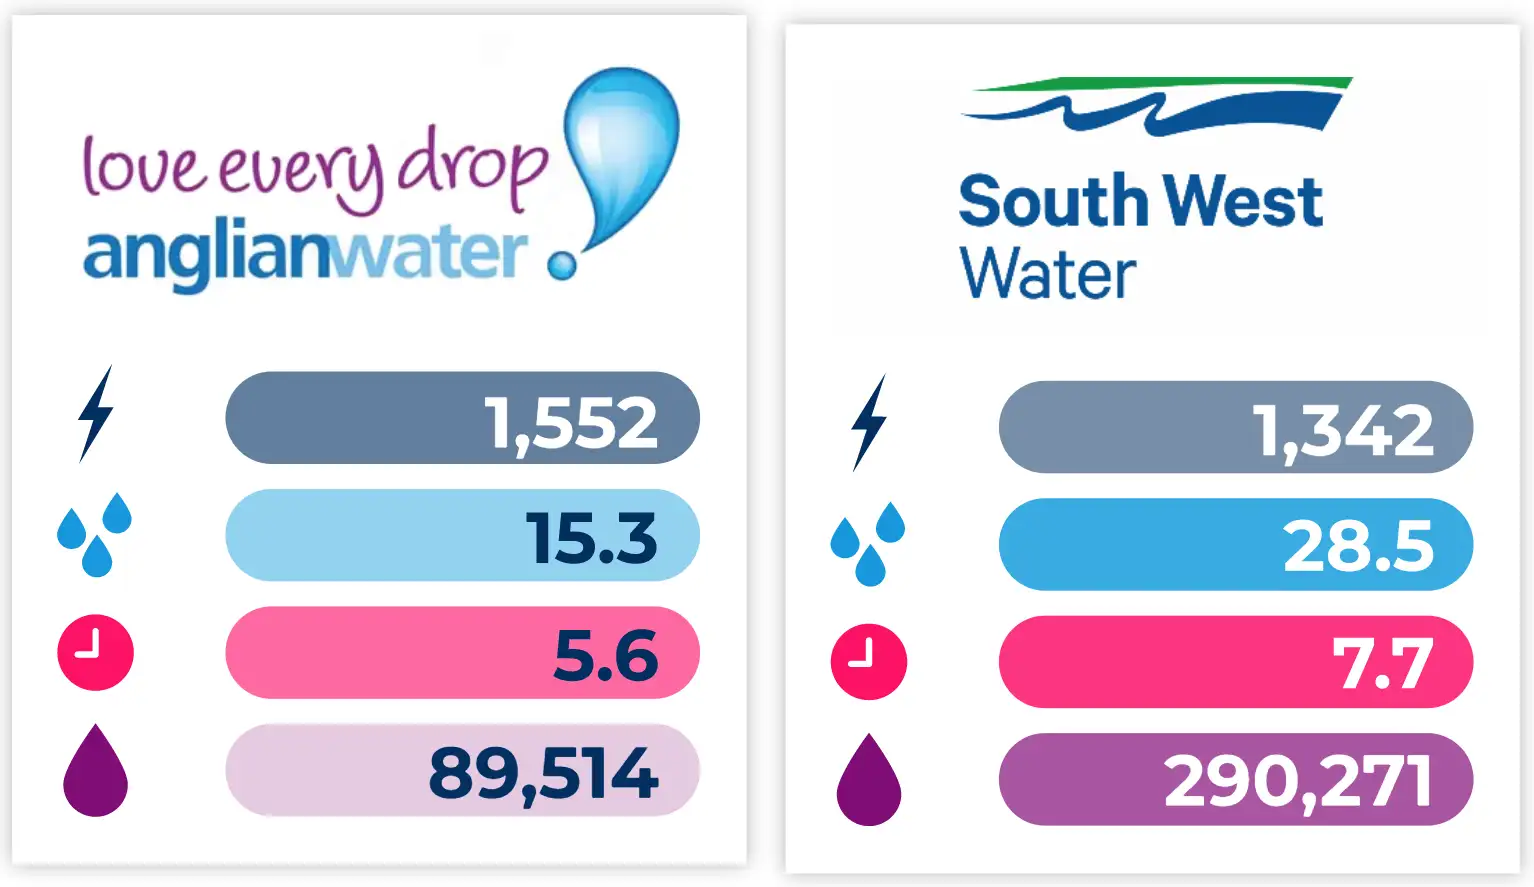
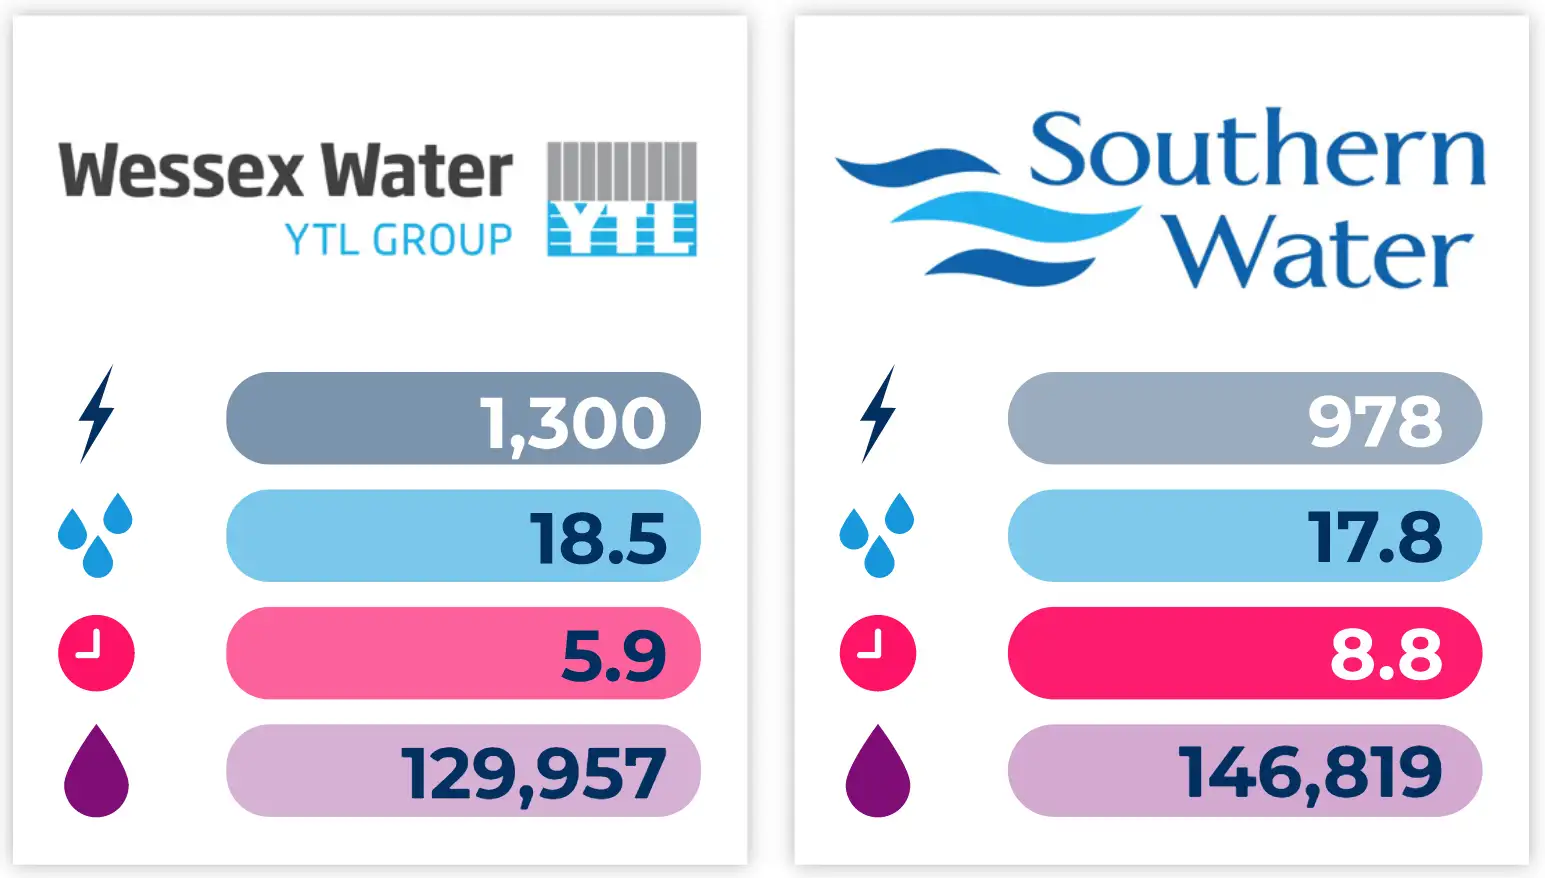
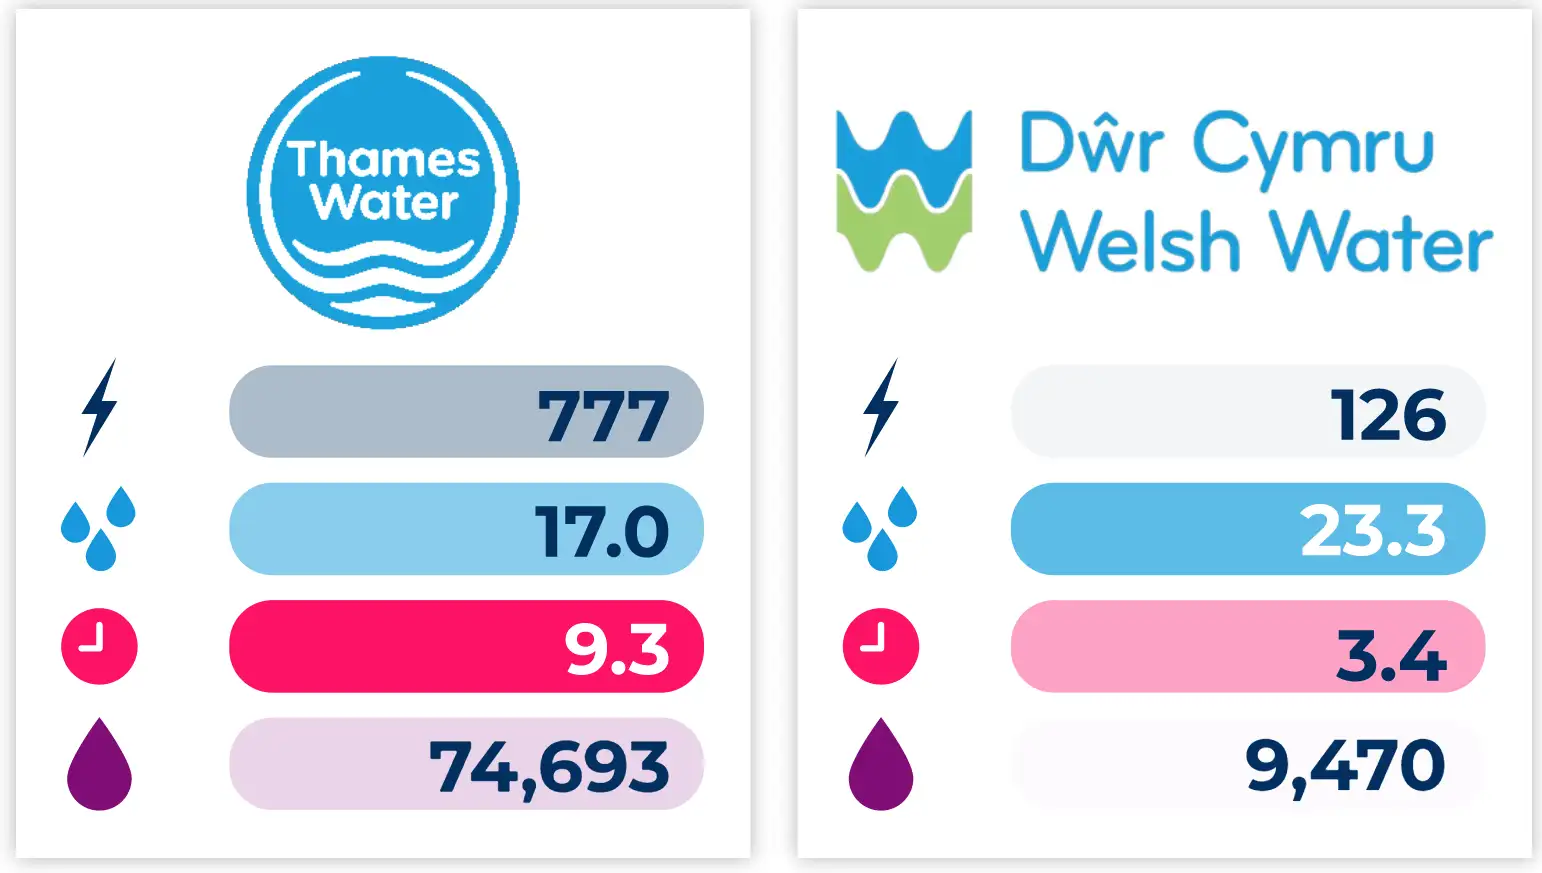
From our analysis of Government data, we were able to identify which water companies had the most storm overflows and are polluting more raw sewage into the waterways in England and Wales.
The data shows Severn Trent Water had the most storm overflows in 2022 at 2,466, resulting in an average of just over 18 per overflow and lasting for an average of 5.6 hours. While you sit back and watch the first two Harry Potter films (five hours and 13 minutes), EC and IE are actively polluting our waterways in England and Wales.
However, it was United Utilities that had the highest duration of spill events monitored in 2022, at 425,491 hours of raw sewage dumping. This is 37.8% more than the next highest of South West Water, at 290,271.
What People Are Saying
"It is simply scandalous - I'm fairly certain that that's exactly why this has become the huge political issue.
"Because normal people - how could you not be affronted? How could you not be filled with anything but a deep righteous, furious anger?
"That you put your trust in the system. You bring your children to beaches like this on a Bank Holiday Monday, later discover those children were swimming in somebody else's waste."
FEARGAL SHARKEY


BARRY MCGUIGAN
"I've lived here 34 years. Tankerton is just down the road from us. That is the busiest tipping point in Kent.
"You know, when you see this - and it doesn't happen all the time - but you see the colour of the ocean changing and you see this stuff coming in towards the shore. It makes you want to throw up."
“For decades the focus has always been on supplying cheap good quality water to the population. The environmental objectives have not been focused on.”
LORD CROMWELL

member/2594/contact
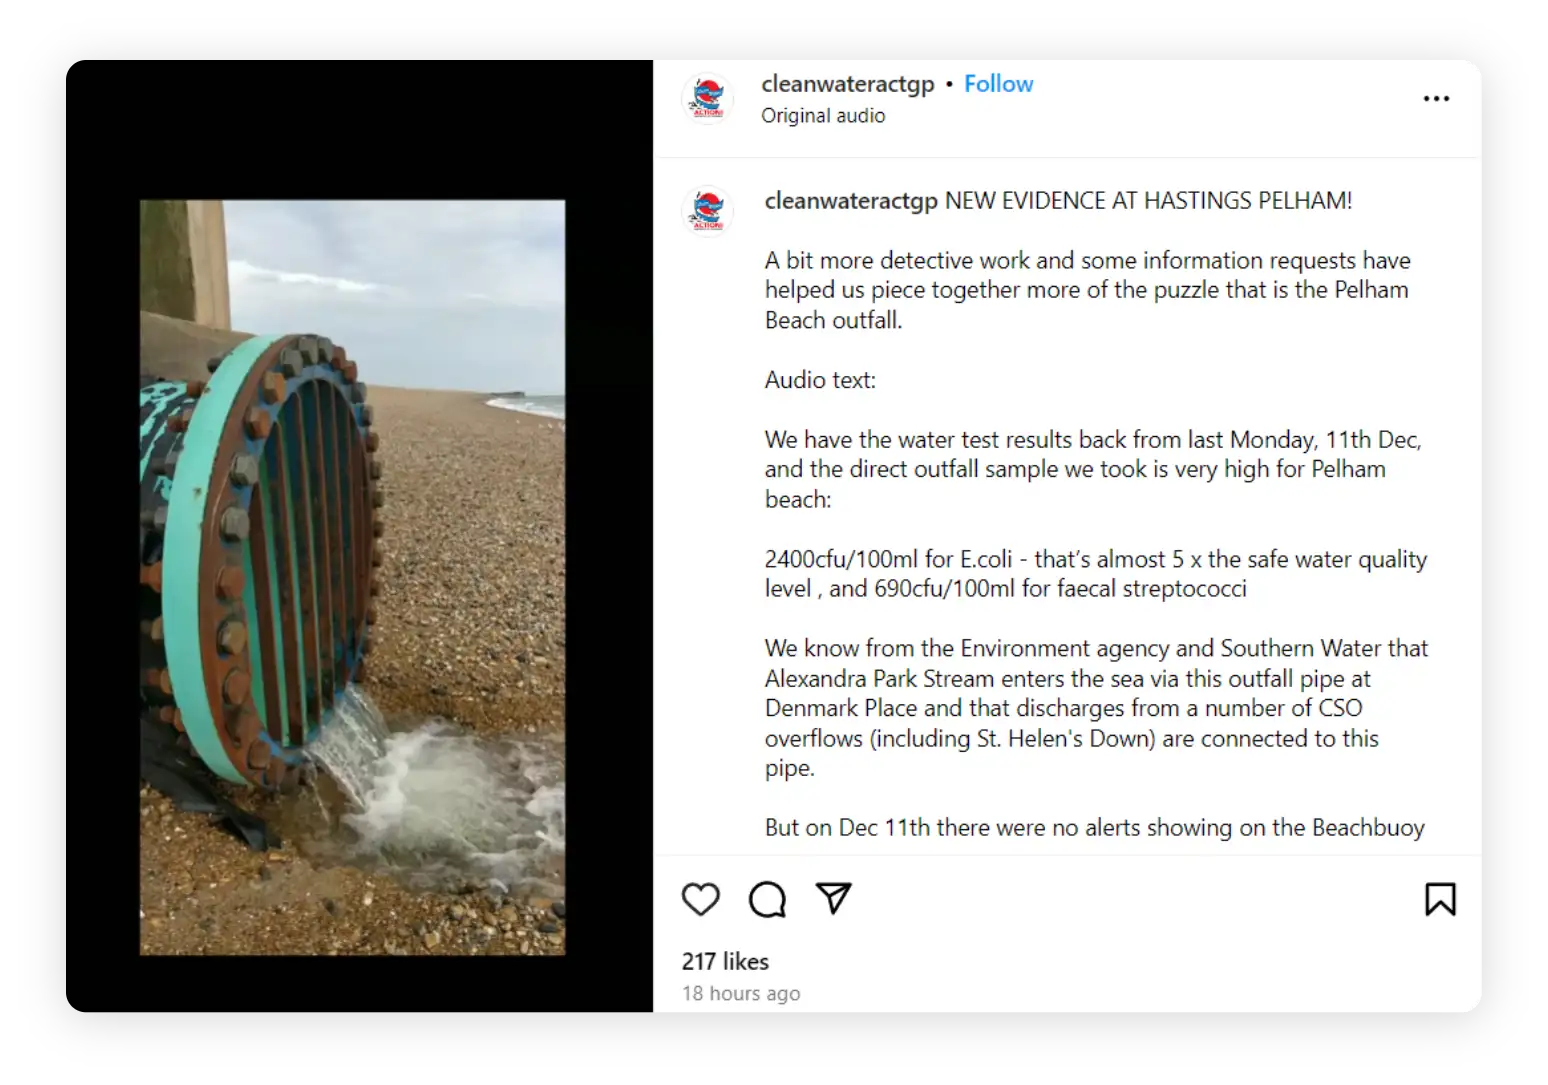
Social Media Reactions


MORE REBOOT RESEARCH
As an SEO company and digital PR agency, we conduct regular data-led studies in order to create educational blog content. Our digital PR assets cover a wide range of topics, creating campaigns based on our own research and data gathered.

MORE RAW SEWAGE RESEARCH
For further data, breakdowns, and comparisons on the dumping of raw sewage into waterways in England and Wales, visit Top of the Poops.
Methodology
-
A dataset containing over 16,000 geocoded storm overflow site locations in England and Wales
provided by The Rivers Trust was collected.
- The dataset contained metrics for overflow sites with EDM (Event Duration Monitoring) data, including the number of counted spills (12-24h count method), total spill hours, and the local authority within which the site was located.
-
The Met Office HadUK-Grid dataset was used to acquire daily gridded precipitation
observations on a 1km grid over the UK.
-
A spatial buffer of 5km around each overflow site was used to find the number of
heavy rain occurrences in proximity to the overflow site.
- A heavy rain occurrence was defined as any day with 25mm or more of precipitation in any given area.
-
A spatial buffer of 5km around each overflow site was used to find the number of
heavy rain occurrences in proximity to the overflow site.
-
The EDM storm overflows data acquired from the river trust and precipitation observations
from the Met Office were subsequently aggregated by local authority to calculate the total
number of overflow sites, total counted spills (12-24hr count method), total duration of
spills, average number of heavy rain days and average number of spills per heavy rain day.
-
The 12-24hr spill count method is defined by gov.uk as follows:
- "Any discharge (or discharges) in the first 12-hour block are counted as one spill. Any discharge (or discharges) in the next and subsequent 24-hour blocks are each counted as one additional spill per block. Continue counting until there is a 24-hour block with no discharge"
-
The average number of heavy rain days is calculated as follows:
- For each day, capture only rain within 5km of overflow site
- Filter out any instances of rain that are less than 25 mm
- Count the number of unique days that have had heavy rain for each overflow site. E.g., if for overflow site A, Jan 1st had two instances of 25mm of rain, and Jan 2nd had one instance of 25mm of rain, and the rest of the year had no rain, the number of unique days is two (as there are two days that had any heavy rain).
- Finally, average the number of unique rain days by local authority
- The average number of spills per heavy rain day is averaged for each individual overflow location, which is then aggregated by local authority (average) and will not be the same as (total spills/ heavy rain days).
-
The 12-24hr spill count method is defined by gov.uk as follows:
-
Bathing water quality samples between 2017 - 2023 were collected from the Environment Agency
and subsequently used to identify the average annual 95th percentile of both Intestinal
Enterococci (IE) and Escherichia Coli (E. coli) traces (cfu/100 mL) in all bathing waters
within 5km of an overflow site. Both IE and E. Coli are bacteria found in intestinal tracts
of humans and are likely remnants of faecal matter.
-
Average count of each of these factors are calculated as follows:
- For each overflow site, the 95th percentile of samples in that year/year group was obtained
- Then, the average of these samples was calculated for each local authority/year. Therefore, this is the average of the 95th percentiles.
- It must be noted that multiple factors contribute towards bacterial counts in bathing waters, including animal discharges. While filtering bathing waters to those within 5km of an overflow site helps narrow the likely cause of changes in bacterial counts, it may not be the sole contributing factor.
-
Average count of each of these factors are calculated as follows:
-
The 3-year annual 95th percentile average of EC and IE counts calculated in the previous
step were then averaged by local authority to calculate the percentage change in both EC and
IE counts between the periods 2018-2020 and 2021-2023. A normalised degradation score is
subsequently calculated considering the percentage changes in both EC and IE counts. An
additional bathing water quality score is calculated using the average annual 95th
percentile of bacterial counts in the period 2020-2022.
- A yearly average from 2018-2023 was also calculated to show year on year how the samples change. The average sample size for each year/area is 87 samples, with the lowest average sample for an area is equal to 12 samples taken.
-
For each year, the % change from the past year was calculated. These year-on-year %
changes were then combined as a weighted average using the following weights:
- 2018/19 - 0.15
- 2019/20 - 0.15
- 2020/21 - 0.2
- 2021/22 - 0.2
- 2022/23 - 0.3
- This final weighted average % change shows how the bathing water quality has changed over the years, with a bias towards the past 3 years (as those are more important to today's water quality).
-
By using percentile thresholds from environment.data.gov.uk, the average percentile by local
authority/district were evaluated.
- Most of the bathing waters in the UK are coastal, so only non-coastal districts (i.e. local authorities that do not have a border with the ocean) were evaluated with the inland bathing water thresholds, these are highlighted red in the data.
-
The classifications were then converted to a numerical score in order to rank each
local authority/district:
- Poor - 1
- Sufficient - 2
- Good - 3
- Excellent - 4
- These scores were then averaged to provide an overall look at the bathing water quality of each area.
- EDM data detailing long-term trends was acquired from data.gov. Statistics provided in the dataset were used to provide breakdowns by water company comparing the number of storm overflows, average spills per storm overflow, average duration (hrs) per monitored spill and total duration of spill events monitored.
- The long-term EDM trends dataset was also supplemented with bathing water quality samples to provide, for each year between 2017-2023, the average annual 95th percentile of EC and IE counts in bathing waters together with average spill duration (hrs) and the average number of spill events per overflow for the years (2017- 2022). The percentage changes in the aforementioned metrics were calculated as the average between 2018-2020 compared to the average of the remaining periods.
Sources
Bathing waters data (no date) Gov.uk. Available at:
https://environment.data.gov.uk/bwq/profiles/data.html
(Accessed: March 4, 2024).
CEDA Archive web browser (no date) Ceda.ac.uk. Available at:
https://data.ceda.ac.uk/badc/ukmo-hadobs/data/insitu/MOHC/HadOBS/HadUK-Grid/v1.2.0.ceda/1km/rainfall/day/v20230328
(Accessed: March 4, 2024).
Environment Agency (2024) “Event Duration Monitoring - storm overflows - annual returns.”
Event duration monitoring - storm overflows - 2021 (England and Wales) (no date)
Catchmentbasedapproach.org. Available at:
https://data.catchmentbasedapproach.org/datasets/
2cf731d1782f4a899c317be83f221226_11/explore?location=>52.716396%2C-3.144202%2C7.00
(Accessed: March 4, 2024).
Event duration monitoring - storm overflows - 2022 (England and Wales) (no date)
Catchmentbasedapproach.org. Available at:
https://data.catchmentbasedapproach.org/
datasets/cd83fb0f4b084557a0537fbbd7e20153_0/explore
(Accessed: March 4, 2024).
Georgiou, S. (2005) “Bathing water quality,” pp. 75–101. doi: 10.1007/3-540-27150-3_4.
Met Office et al. (2023) “HadUK-Grid Gridded Climate Observations on a 1km grid over the UK, v1.2.0.ceda (1836-2022).” NERC EDS Centre for Environmental Data Analysis.
Notes
- Only EDM sites containing local authority labels provided by the river trust were analysed for local authority breakdowns.
- Kensington and Chelsea has been omitted from our bathing water quality analysis as notes provided by the Environment Agency state animal faecal release as the likely cause of high bacterial counts.