
Download our comprehensive data source directory
- What is a Hyper-Relevancy Project (HRP)?
- Why HRP can be a better choice than digital PR
- When HRPs overtake digital PR
- Typical HRP results
- Building hyper-relevant assets
- Stage 1: Research and topic selection
- Stage 2: Data sourcing
- Stage 3: Planning
- Stage 4: Content creation
- Stage 5: SEO optimisation and upload
- Stage 6: Outreach
- Stage 7: Long-term visibility maintenance
- Hyper-relevancy examples in action
- Key takeaways
_____ THE HYPER-RELEVANCY PLAYBOOK
How to Build Data-Rich Assets That Earn Links Over Time
Hyper-Relevancy Projects - also known as "HRP" - are data-led content assets that build topical authority and visibility across search and AI. They attract relevant, high-quality links organically, with no ongoing outreach once live.

In this playbook, we’ll cover everything there is to know about how we plan, build, and launch a Hyper-Relevancy Project, and how you can replicate the approach yourself. Every step is based on live campaigns we have delivered, with real examples and templates you can use.
By the end of this guide, you will know how to launch a campaign from beginning to end - with confidence and ease.
What is a Hyper-Relevancy Project (HRP)?
They are landing pages that live on your website and often take shape as reports or statistical data. These pages are designed to help build topical authority and visibility in search and AI by acting as irresistible linkable assets that attract relevant, high-quality backlinks organically - without any ongoing outreach or investment after launch.
-
Stay relevant for months and years to come
-
Rank for keywords with "journalistic intent" - the exact phrases journalists and content creators search for when sourcing information
-
Build topical authority in your niche
-
Increase visibility in both traditional search results and LLMs
Why HRP can be a better choice than digital PR
Traditional digital PR campaigns, once outreached, often have a short burst of coverage before the news cycle changes.
Comparatively, HRPs compound. They attract a steady stream of links over months from news articles, statistical studies, and resource pages - to name a few.
Digital PR secures coverage from high-authority websites and mainstream news outlets, which are broadly topically relevant. These links are typically earned via proactive outreach, which means competitors are likely to have a similar backlink profile.
By comparison, HRP earns coverage from highly relevant websites and niche industry publications, which are more narrowly topically relevant. As these publications aren’t the type to be found in standard digital PR outreach lists, they are less replicable and help to widen the backlink profile versus competitors.

Digital PR and HRP also earn different link profiles. PR stories are often pitched to newsrooms and magazines, while HRPs win links from evergreen informational content, resource hubs, academic journals, and government pages.
Working in tandem, they can raise a site's overall link velocity and widen referring domain diversity, which supports rankings over the long term.
When HRPs overtake digital PR
We started working with a client in November 2023. Our schedule of work over this timeframe has been digital PR and HRP.
Digital PR started straight away, and the site immediately began earning links through our digital PR efforts. Due to a comprehensive research and data collection process, HRP assets took a month to get off the ground. However, once published, the assets became more discoverable and cited more often.
Three months later, the links earned by HRP assets overtook the number of digital PR links earned. At the time of writing (August 2025), the number of HRP links earned is almost double that earned from digital PR (449 vs. 811).
Working together, the total number of links has reached new heights.

On average, our HRPs earn 40+ referring domains within 12 months, with many surpassing 200+.
Typical HRP results
Internal analysis of our HRP campaigns found that, in a 12-month period, a single HRP asset earns an average of 41 referring domains and has 16 keywords ranking in the top 10 (or page one).

Naturally, figures can vary by topic breadth and search demand. It goes without saying that broader, well-cited topics typically earn links faster and for longer.
This is why choosing a topic is the most important aspect of an HRP. Get it wrong, and your content won’t reap the rewards you desire.
Building hyper-relevant assets
Ready to get stuck in? We’ve broken down how to build a Hyper-Relevancy Project into a framework of seven clear, easy-to-follow stages. Each stage is designed to maximise the long-term earning potential of the asset, from initial concept to post-publication.

Stage 1: Research and topic selection

At the core of every successful HRP is the topic. It should be hyper-relevant to your client/brand’s niche, supported by credible data, and searched for enough to keep attracting links long after publication.
Here’s a step-by-step guide to the research process:
Step 1: Identify your potential topic(s)
The very first step to identifying potential topics for an HRP asset is to come up with a selection of ideas on topics and subjects that hit the sweet spot between industry relevance and newsworthiness (having "journalistic intent").
Industry relevance
The purpose of an HRP asset is to earn powerful, relevant backlinks over time, so a topic that is not relevant should be parked.
Hyper-relevant topics don’t need to be commercial or focused on the brand's key topic, but there must be some broader connection between the topic being targeted and the products/services/topics being targeted on the wider website.
Take a price comparison website, for example. The brand might offer comparison products across a range of verticals like mortgages, business accounts, broadband deals, and more.
For a client in this niche, an HRP asset that could work would be a "Mortgage Statistics" page, which is broadly relevant to many of the products/services the website offers (mortgage quote comparisons).
This makes a great HRP as links gained in this area would be closely aligned with high-priority keywords they would already be targeting on their website.
See our Hyper-Relevancy Projects in action.
CASE STUDIES
Newsworthiness and "journalistic intent"
Being relevant is not enough. The primary aim is for our content to earn relevant backlinks organically over time. To achieve this, the topic must be newsworthy and have "journalistic intent" to guarantee organic pickup.
What is "journalistic intent"?
Essentially, this means that people are searching for the topics and keywords being targeted, and they are likely looking to create their own news stories, research reports, or content surrounding it.
Statistics-based keywords are a good example of this. People searching for "mortgage statistics" are likely to be looking for facts and figures to add to their own piece of content. It’s unlikely that many people would search for this phrase to read about the latest stats.
Many other keywords have "journalistic intent" and are considered newsworthy - for example, someone searching for "how many people defaulted on their mortgage in 2024" could well be writing an article on the rise in mortgage defaults and want some real data to bolster their piece.
When identifying a topic, keep the following in mind:
-
Relevance to your site’s core themes
-
Clear "journalistic intent"
-
Credible data sources are available
-
Year-on-year updates are possible
-
Multiple angles are doable
-
Strong search volume behind keywords/phrases
Step 2: Confirm you have viable keywords to target
Once you have collated a selection of relevant keywords, the next step is to make sure you can realistically rank for those keywords. This is where you get your analytical head "on".
The best place to start is by searching for your primary target keyword in your search engine of choice. As you review the search engine results page (SERP), you should consider:
-
What already exists out there on the topic
-
Who you would be competing against in the SERP once the page is live (i.e. any official bodies or organisations)
-
How other websites have approached their content and how you could do it better (i.e. thin content)
-
Are there any content gaps that would add value to the topic
-
What keywords do other websites rank for, and how you could optimise your asset better to rank higher
-
Are the top-ranking pages more oriented towards consumers and lacking in journalistic intent and newsworthiness?
-
Are the pages ranking top relatively thin compared to the Hyper Relevancy content that we intend to create?
-
Are the top pages updated within the last 12-24 months? Would a newer, well-cited asset beat them?
Download our competitor analysis template to populate.
DOWNLOAD OUR TEMPLATE
Stage 2: Data sourcing

At this point in the process, it is a chance to take a deep dive into the topic, themes and areas you could include in the asset before you begin planning (stage 3).
You should use this stage as an opportunity to:
-
Identify relevant and credible secondary data sources to use in your content - such as public datasets like the ONS, GOV.uk, FCA, etc.
-
Gather as much information as possible about your chosen topic
-
Review what competitors have included, and ensure any valuable content gaps are filled
-
Ideate for potential unique data you would like to collect yourself, or request from internal teams
Set up a data log
Before you collect any data, set up a simple data log. This helps to keep track of all sources you plan to use, and makes any updates later down the line pain-free.
Data log mini-checklist:
-
Confirm each source’s "last updated" date
-
Prioritise original sources (i.e. ONS)
-
Note down the licence/attribution (only collect data you are permitted to use)
-
Log units, timeframes, and any normalisation choices in a change log
Primary data sources
Primary data is defined as "information that you collect yourself, rather than get from somewhere else" by the Cambridge Dictionary.
This can be a tricky aspect of the process, as it requires getting hands-on with data collection to create a dataset that is unique and cannot be found anywhere else on the internet (adding to the page’s newsworthiness).
For this, we use our team of data scientists, but if you don’t have this resource, you can also lean on internal analysts or teams.
Ideas for primary data include:
|
Method |
Description |
When to use it |
|
Submit targeted requests to public bodies to access unpublished or more granular figures, for example, by region or service. The result is authoritative data you can cite with confidence. |
You want local detail or service metrics that aren’t on public dashboards, and you can allow a few weeks for a reply. |
|
|
Surveys and polls |
Run a structured survey to measure behaviour or sentiment where no official source exists. Document sampling, quotas and weighting so the findings hold up. |
You want timely insight across clear audience segments. |
|
Website scraping |
Collect information from public web pages in line with site terms and robots.txt, then clean and standardise it into a usable dataset. Keep a brief log of selectors and steps so it is reproducible. |
You want data that’s visible on the web but not available as a single download or API. |
|
APIs (public or paid) |
Pull structured data from an API that updates reliably over time. Record the endpoint, parameters and any licence so the process is easy to repeat. |
You want regular refreshes or historical pulls from the same reliable source. |
|
Geospatial analysis |
Attach data to official boundaries such as LSOA, MSOA or local authority to show how patterns change by place. This gives you clear maps, league tables and proximity checks. |
You want to show differences by place or rank areas. |
|
Sentiment analysis |
Analyse text from news, reviews or social posts to classify tone or topics. Validate a small sample by hand to keep results fair and reduce bias. |
You want to quantify how people talk about a theme over time. |
|
Forecasting using historic data |
Build a simple time-series model from historical data to project new figures for the future. |
You want a view of the next few months/years based on past patterns. |
|
Index study (combining datasets into a score) |
Combine several datasets into one normalised score, with clear weights and a short method so anyone can reproduce it. Publish sub-indices as well as the overall score. |
You want one clear ranking from several related datasets. |
|
Sourcing data from internal teams (first-party data) |
Use anonymised product, sales, CRM or analytics data, plus any internal survey or behavioural data, to create metrics only you can publish. Keep what you included privacy-safe and documented. |
You want unique, owned metrics that reflect real customer behaviour. |
As well as the above options, it's worth considering any primary datasets you may already have to hand. For example, from digital PR campaigns from your internal team or a digital PR agency.
Before using, be sure to check the date range. If it’s too outdated, rerun the same methodology to produce fresh statistics. You can then compare editions like-for-like to highlight any changes and key trends.
How to come up with strong primary dataset ideas
"Before requesting primary data for HRPs, it's essential to conduct a gap analysis to identify existing gaps and generate ideas that add value to the topic in question.
Sometimes it's best to tackle the low-hanging fruit and look for simple ideas, such as forecasting and calculating percentage change over time. These are often less time-intensive, yet can still provide some interesting, unique data for the page.
For more complex datasets, it's best to look at combining data sources, such as looking for correlations and patterns. This may also include the use of index studies to help deliver multiple angles from a content and PR perspective and squeeze every bit of juice out of the data."
SEAN RAINFORTH
Secondary data sources
For your content to be taken seriously by search engines, large language models (LLMs), and publishers, the data you include in your content should be as up-to-date as possible and from authoritative sources.
-
Begin with governing bodies related to the subject, as they are the most accurate and trustworthy sources, and are typically updated regularly.
-
The data you use should be no older than two years at most. But this is dependent on the topic and source. The more recent, the better.
-
Look at articles ranking top for your target keywords, and see who they cite as sources. Can you find more up-to-date versions of them (or similar datasets) to inform your content? Would it be worth including those same ones in your article?
Fancy getting your hands on our list of 70+ authoritative and trusted secondary sources?
DOWNLOAD OUR DIRECTORY
That said, sometimes it’s necessary to include multiple years to show the changes over time, such as price.
As a general guide, we recommend the following:
-
Annual datasets: 10-year comparison (max.)
-
Quarterly datasets: five-year comparison (max.)
-
Monthly datasets: three-year comparison (max.)
-
Weekly datasets: one-year comparison (max.)
-
Daily datasets: one-month comparison (max.)
How to check the reliability and authority of data sources
"For our HRPs, credibility and authority are essential in positioning our clients as leaders in their field. To achieve this, we combine trusted external sources with our own primary analysis to deliver meaningful, data-driven insights.
When sourcing data, we prioritise reliability and transparency. Our first check is whether the methodology behind the data is clearly explained, including how it was collected and any limitations that may affect interpretation. The best and most trustworthy sources are those that clearly explain how they obtained the data and any limitations that need to be addressed. In addition to trustworthiness, we assess recency (when the data was last updated) and evaluate whether shifts are likely to have occurred since. Where necessary, we update or model the data ourselves to ensure relevance and produce fresh, up-to-date insights.
Beyond strong secondary sources such as government databases, think tanks, and research organisations, we place strong emphasis on generating our own primary data. This may involve re-analysing existing datasets for fresh insights, applying creative methodologies to extract data from platforms relevant to our clients’ audiences (e.g., social media, job boards), carrying out our own surveys or leveraging historical datasets to model trends and forecast future outcomes.
By combining rigorous sourcing with original analysis, we deliver insights that not only inform but also differentiate our clients as authoritative voices in their space."
PAUL LAPHAM
Stage 3: Planning

Now that you have identified key primary and secondary data sources for your content, it’s time to start bringing the asset to life.
This stage is all about content structure, keywords (and search intent), which source is being cited where, etc.
As a starting point, collate a list of all of the keywords you wish to include in your asset. There are a few ways to do this - free or paid.
Popular free keyword research tools
|
"People Also Ask" in the SERPs |
When conducting keyword research and determining what keywords/phrases to target, you should consider:
-
Synonyms and alternative phrases
-
Keyword volume
-
Search intent
-
Your target audience ("journalistic intent")
-
Keyword difficulty ratings
Once you have identified a selection of keywords for your asset, it’s time to start populating them into a plan. You will use this as a reference when writing your asset.
We have created a planning template similar to what we use in-house, which includes:
-
A rough structure - including headings and subheadings,
-
Where keywords should be targeted
-
Where data sources should be used
-
A notes section explaining what each area should cover
-
Design ideas for the data sources used
-
Frequently asked questions to target
-
Glossary terms to define
-
All sources and methodologies used
Download our HRP planning template - including structure, keywords, sources, and design cues.
DOWNLOAD OUR TEMPLATE
Stage 4: Content creation

Turn your research into a data-led asset that reads with authority and is effortless to cite. The writing should be clear and human. The layout should help readers find the key facts quickly without sacrificing depth.
Top tip: Make your content easy to cite
Help editors, search engines, and LLMs digest and cite your content easily by using descriptive headings, links with clear anchor text, alt-text, etc.
Write in a confident, plain style. Lead with facts, then explain what they mean. Avoid hype. Use short paragraphs and straightforward sentences so journalists, Google, and AI systems can parse the page easily. Define any terms on first use and keep a small glossary for recurring jargon.
Download our foolproof HRP asset template.
DOWNLOAD OUR TEMPLATE
Introduction
Once your meta title and description are complete, it’s time to move on to the content writing. Open the asset with a short introduction - this should be around two small paragraphs in length and include the asset’s primary keyword (i.e. "mortgage statistics").
Our tried-and-tested introduction formula is as follows:
-
One-line definition of what the asset is all about
-
One or two headline stats to set the scene
-
Highlight the asset’s benefit to the reader
-
State any core timeframes
Bullet point summary
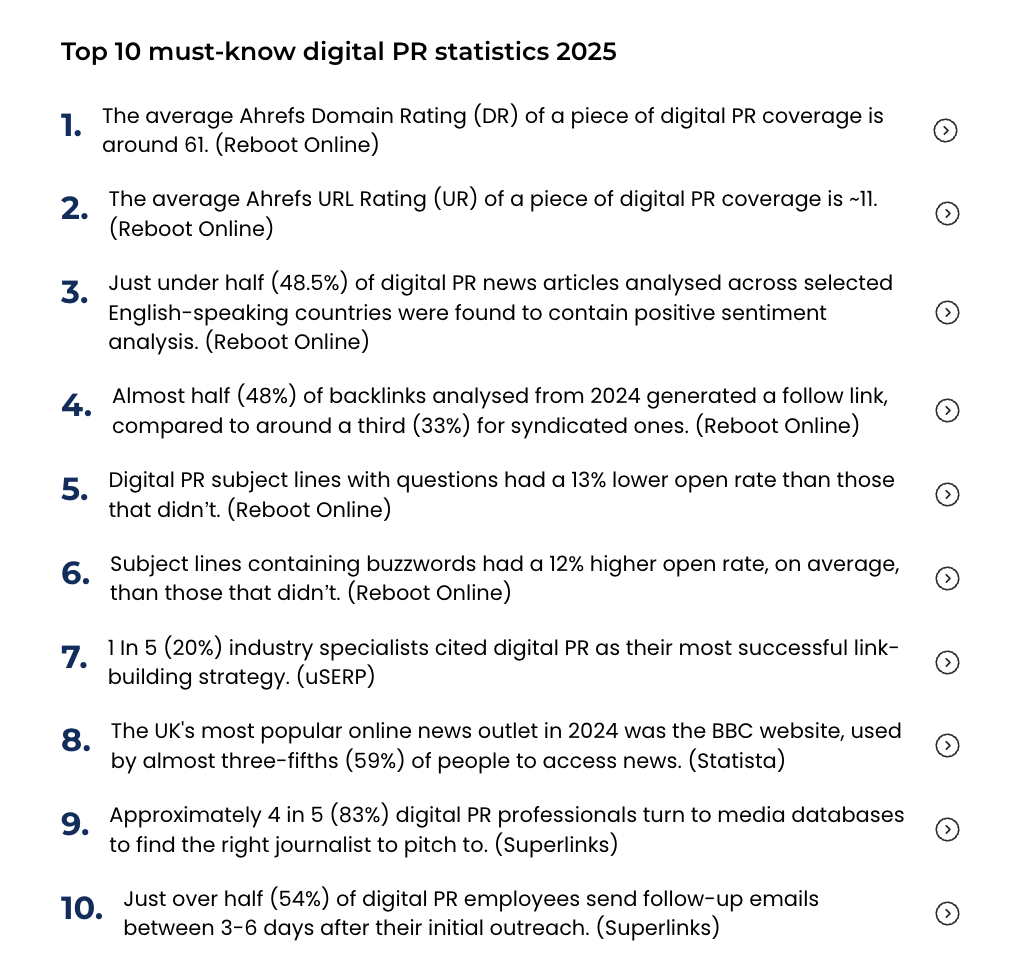
Directly under the introduction, consider adding a bullet point overview collating all of the key stats from your asset.
A short, stat-first summary gives journalists, editors and busy readers the top numbers at a glance. It also makes your asset more citable, because they can find the exact figure immediately and attribute it with confidence.
As a guide, aim for between five and 10 bullet points covering top findings - and ideally with each link anchored to the relevant section in the content.
Here's an example from our Digital PR statistics asset:
Body content
The tone should be authoritative to position your content as a credible asset to cite, and highlight the overall brand as a thought leader in its field. However, the content must remain accessible; journalists, Google, and AI must be able to understand it, otherwise it won’t rank and gain links.
Following the in-depth strategy plan you created in stage 3, start from the first heading and work your way down each row, making sure each aspect of the plan has been taken into account - i.e. sources, keywords, primary data, etc.
As an HRP is a data-led content asset, you should lead with facts and data points. Structure-wise, you may want to begin with the key finding in the first line, and write a short explanation of what it means and why it matters.
Keep your commentary tight, including one or two paragraphs that interpret the findings and any patterns, and add context without giving your opinion.
End each subsection with a one-line summary that points to the next question the data raises. This keeps readers moving, reduces bounce rates, and helps AI and LLMs understand the logical flow of the page.
How to structure content for AI visibility
"When it comes to structuring your content for AI, there are a few key things to keep in mind.
The first thing is your structure and formatting. You want to make it quick and easy for an AI model to parse your copy, so making use of quick take away sections like bullet point lists can help.
You also want to avoid waffling, instead opting to keep your paragraphs concise and to the point. This will help the AI pull out the most relevant sections to inform its response.
You also want to be factual, avoiding making incorrect or inaccurate claims that could harm your credibility.
You also want to make sure that your content offers something unique to encourage the AI to cite it in its response. Including unique data or facts, or an interactive tool relevant to the topic at hand, is a great way to do this.
Finally, schema should be something you’re thinking about to help AI models better understand your content and the entities found within it."
OLIVER SISSONS
Data visualisations
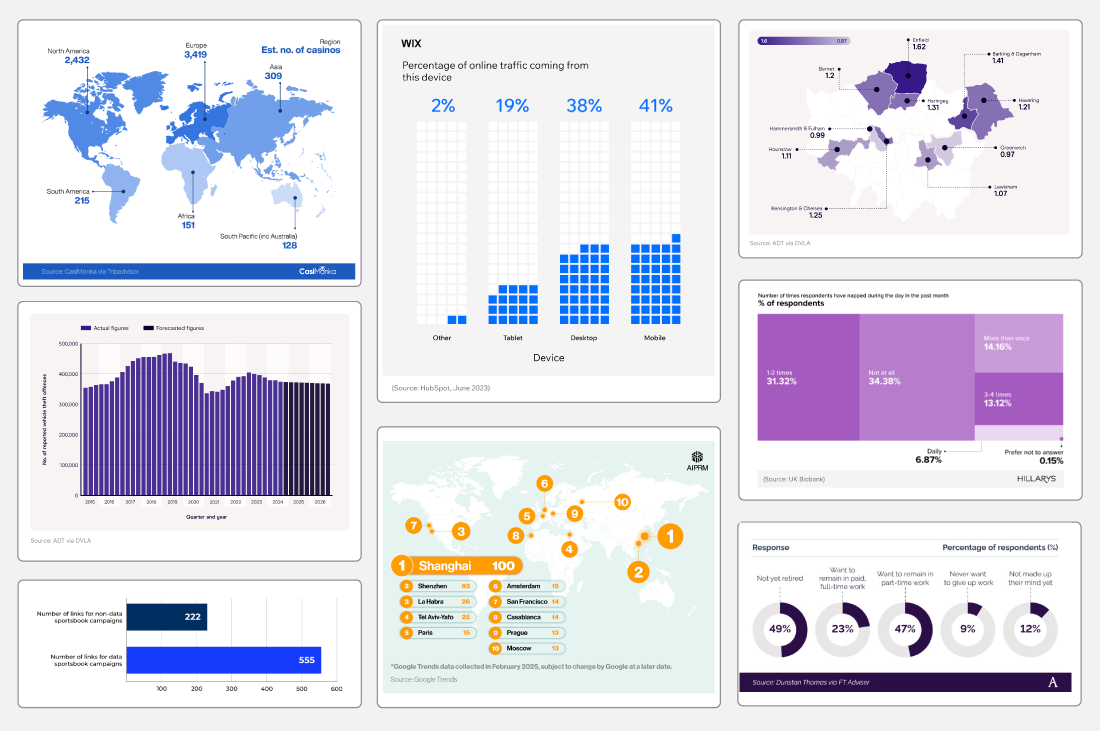
Where relevant, pair each subheading with a strong visual. Use charts, maps or tables placed close to the paragraph that explains them - and be transparent with labelling the source(s) and timeframes accurately.
Choose formats that make comparisons obvious - for example, a bar chart for rankings, a line chart for change over time, or a map for regional splits.
Top tip: Add concise alt-text so screen readers, search engines and LLMs understand what each graphic shows
Alt-text should ideally be less than 100 characters in length and outline the type of graphic and what it is showing.
Good alt text Bar chart showing average UK car insurance cost by age group (£), 2024. Poor alt text Chart about insurance prices.
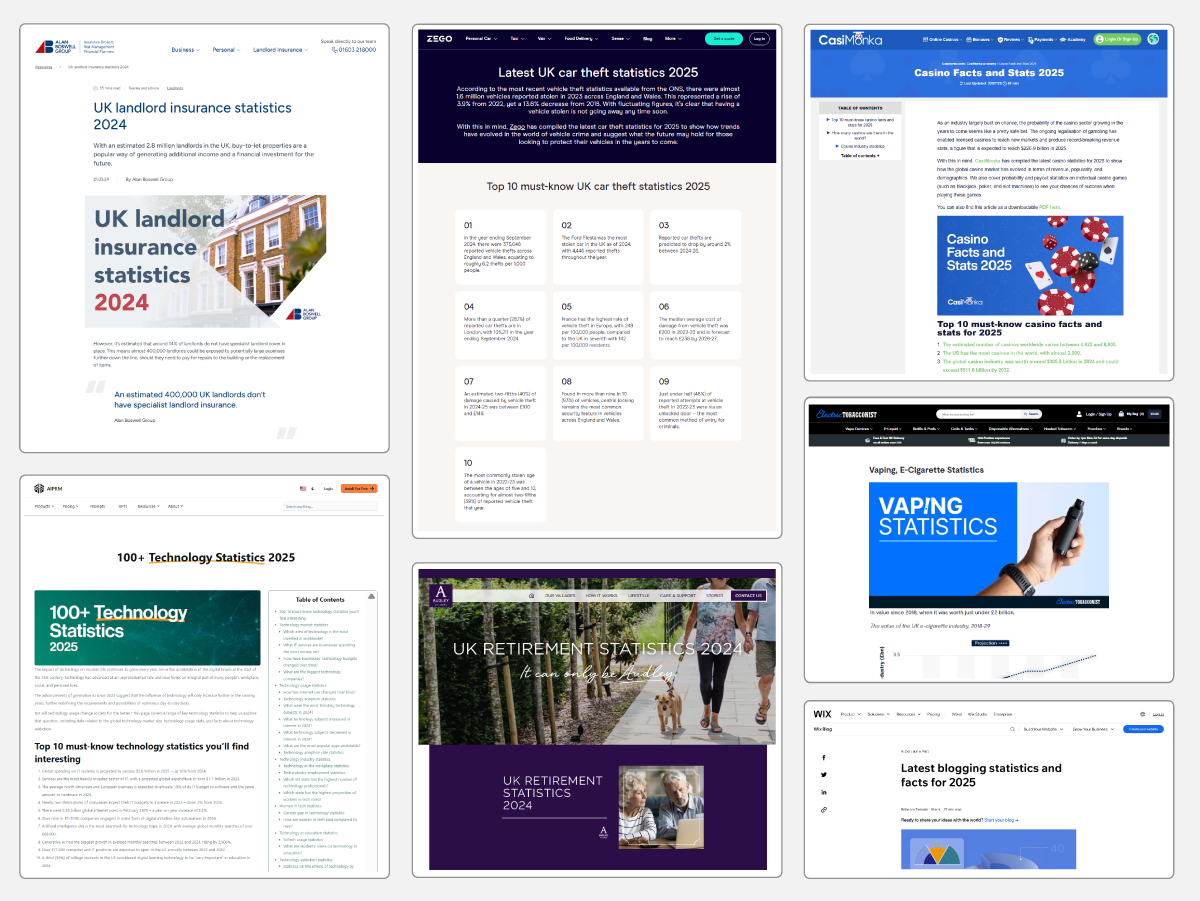
Data visualisation examples:
Wrapping up the content
Close with a short conclusion that ties back to the main topic and the key finding, before moving on to citing all sources and outlining any methodology used.
✅ Disclose all sources used
At the end of the content, list every source in the order it appears with the publisher name, page title, URL, publication date, and date accessed. If you changed any of the data, add a one-liner explaining what you changed - for example, "normalising per 100,000 people or adjusting for inflation".
Example format: Publisher. Page title. URL. Dataset title/version. Publication date. Date accessed. Notes on any transforms (i.e. inflation-adjusted, per-capita).
✅ Outline all methodologies used
State data collection dates, selection criteria, exclusions, any weighting or normalisation, rounding rules, and known caveats.
For transparency, show sample sizes and error margins where relevant, and link to the raw dataset in a read-only format.
Example format: We converted local currency to GBP using the ONS average monthly rate, normalised per 100,000 adults, and rounded to one decimal place. £1,240 average × 12 months ÷ 100,000 adults = 0.148; shown as 0.1 after rounding.
✅ Include a short glossary
Define acronyms, units and any terms that could be misread. Keep definitions to one line so readers can scan them quickly.
✅ Finish with FAQs - designed for featured snippets, AI overviews and LLMs
Select precise, stats-based questions that tie into the topic - for example, "How many homes were repossessed in the UK in 2024?". Make sure the question is answered succinctly with data.
Top tip: Mark up the FAQs with FAQPage schema, and write answers so the first 25-30 words can stand alone in a snippet.
Stage 5: SEO optimisation and upload

This stage of the process is all about making the page easy for journalists, search engines, and LLMs.
Use a hierarchy in your content structure
Use your page’s primary keyword naturally in the H1, opening paragraph, and one H2 - for example, this may be "mortgage statistics".
Thereafter, place secondary keywords where they fit - for example, these may be "what percentage of mortgage applications are approved" or "how much is the average mortgage".
Top tip: Include variations people use to find data, such as "statistics", "stats", or "report".
Optimise subheadings
To help gain featured snippets or be cited by AI, both in AI Overviews or LLMs, you should optimise your subheadings for common queries.
For example, questions like "what percentage of mortgage applications are approved" or "how much is the average mortgage" can be answered using either primary or secondary data sources.
When answering these, lead with the statistic first, followed by a few lines of explanation or context. This helps bots to easily understand the answer and be more likely to reference your content.
Top tip: Answer the query in the first 25-30 words
It’s also worth including "as of [month] [year]" for clarity.
Complete the basics
Meta titles and meta descriptions help bots understand what a page is about, assisting in:
-
Improving a page's visibility in search results
-
Attracting more organic traffic to a website
-
Increasing user engagement and click-through rates
-
Communicating the value of a webpage to both search engines and users
As a general rule of thumb:
-
A meta title should be no longer than 64 characters
-
A meta description should be no longer than 155 characters
Top tip: Avoid the use of special characters
For example, characters like "&" don’t always format correctly, sometimes resulting in "&".
Add the right schema
Mark the page up as an Article or Report, and use Dataset for any downloadable files and FAQPage for your snippet-focused questions.
As with any content you publish on your website, you should include BreadcrumbList, an author with a job title, and a "last updated" date clear for users to read, so E-E-A-T signals are clear.
Check technical health is up to scratch
Before hitting publish on any new website page, you should conduct a technical health check.
You should look to confirm:
-
Indexability
-
Canonical tags
-
Robots.txt
-
Sitemap inclusion
It is worth running a Lighthouse check using Google’s Lighthouse tool and fixing anything that harms Core Web Vitals. This can affect the performance of your content.
If load time is slow, consider compressing images and "lazy-loading" any images that appear below the fold to ensure optimal performance.
Tidy up images and tables
Use descriptive file names and concise alt text (ideally under 100 characters) that state the graphic type and what it shows.
Label every visual with a visible source, and provide a timeframe so editors can cite you without having to go digging to confirm or verify validity.
Example format: Source: [name], [year]; last updated [m/yyyy].
Check keyword optimisation
When finalising the content, bear in mind whether the page is fully optimised for the primary and secondary keywords - as outlined in our plan in stage 3.
Once you’re happy with the inclusion of keywords, using "Ctrl + F", count up how many times each keyword appears in the content. If there are any keywords lacking for full optimisation, now is the time to add them in.
Add internal links
Internal linking is a key aspect of an HRP asset. They help ensure that search engines (and LLMs) can quickly find and index/rank our new page. They also help to spread "link juice" once organic links are earned, to help spread authority sitewide.
As a general rule of thumb, an asset should include at least five internal links. These are areas where you would like the asset to be linked to elsewhere on your website (where the HRP will be published).
As a minimum, consider starting with one link from your category hub, two related guides, one service page, and one blog explainer.
The key is to add a link to existing content with minor changes to use your primary keyword (or a variation of it) as the anchor text. If/when no existing content exists to add a link to, you should select the most relevant pages to your new HRP page and write new content to add a link back to your HRP page.
Top tip: To find pages relevant to link to, head to Google and search - site: [yourdomain.com] [your topic]
This will return a list of indexed pages that Google is aware of and believes link to your topic. These will be good candidates for internal links to your new asset.
Once each of these areas is complete, your HRP is ready to be published.
Stage 6: Outreach

This step is entirely optional - some HRPs earn links organically without any outreach at all. But a small burst of top-tier, relevant links helps the page rank faster and signals trust to Google.
Carefully targeted outreach (via digital PR and manual outreach) helps to give the page an injection of authoritative, relevant links - organic coverage comes thereafter.
How to find hyper-relevant contacts
Hyper-relevant PR campaigns begin with an idea that is highly tailored to the client’s niche, which has journalistic intent. The same approach is needed for any outreaching hyper-relevant content pieces.
Our Senior Outreach Executive, Sandra Leung, explains how to find hyper-relevant contacts to target.
Hyper-relevant campaigns begin with an idea that is highly tailored to the client’s niche, which has journalistic intent. The same approach is needed for any outreaching hyper-relevant content pieces.
Identify voices of authority and industry trends
Outreach should be informed by key voices of authority within your client’s target sector. These are the publications, organisations, or experts that are reliable sources backed by experience and expertise.
Identifying these voices will direct your understanding of the industry trends, and subsequently inform your outreach with hooks, points of interest, and specific data that is most valuable. Not only so, but these voices of authority can also become a starting point to finding outreach targets to pitch to, or to outreach themselves.
Think outside the box for your outreach targets
Due to the high topical authority and evergreen nature of hyper-relevant projects, outreach targets for these campaigns also need to extend beyond typical outreach targets such as news outlets and magazines.
On top of those publications, also consider companies, charities, and other organisations (e.g. government pages, university websites, etc.) that would have an interest in sharing the niche research.
Hand-pick contacts to build a highly relevant media list
Once the most relevant outreach target has been identified, the right journalist or contact from that publication or organisation has to be identified in order to ensure the pitch reaches the person who will be most interested in seeing it.
Carefully review the job title and their past coverage to verify their relevance.
Target outreach and tailor your pitch
Put particular focus on quality over quantity when it comes to outreach to not only achieve better results, but also optimise your efforts to spend more time on targeting the sectors that have the greatest relevance to your client.
To achieve the best results, immediately establish the connection between your hyper-relevant research and the outreach target who is receiving it on the other end. Tailoring your headline, introduction, and body of the press release to quickly identify why they are receiving this, and why it is relevant to their audience, and why it is relevant to them now.
How to secure relevant backlinks
Here’s how we secure relevant backlinks for HRPs in practice:
"While many hyper-relevancy statistics pages can earn links organically, a strategic outreach campaign provides the initial velocity needed to accelerate rankings and establish trust signals with Google. The key lies in precision over volume.
Our approach begins with identifying authoritative voices within the client's specific sector - the publications, experts, and organisations that genuinely shape industry discourse. This research phase is crucial because it informs not just who we target, but how we craft our messaging with the hooks and data points that truly resonate.
What sets hyper-relevant outreach apart is expanding beyond traditional media outlets. Given the evergreen, niche nature of these statistics pages, we also target companies, charities, government bodies, and academic institutions that have genuine interest in the research.
The magic happens in the personalisation. We hand-pick specific contacts, reviewing their coverage history and beat to ensure our pitch reaches someone who'll genuinely value the content. Each outreach is meticulously tailored - from headline to body copy - immediately establishing why this research matters to their specific audience.
This targeted approach delivers that crucial initial burst of authoritative, relevant links that signals quality to search engines, while the inherent value of the content continues attracting organic coverage long-term. It's about building momentum, not just securing one-off placements."
JAMES OLLIVER
Stage 7: Long-term visibility maintenance

As with any piece of content, it is important to refresh the data regularly to keep the page up-to-date and evergreen. This is more important than ever in the age of AI, as an Ahrefs study of 17 million citations found that LLMs prefer citing newer and updated content compared to organic search results.
The analysis revealed that AI assistants tend to favour more recently updated content, with an average time elapsed since the last update of 909 days, compared to 1,047 days for organic search results (13.1% difference).

Source: AHREFS
When publishing your content, consider flagging when the sources you have used are typically updated. Make a note in your calendar to set aside time to keep your content up-to-date with relevant changes, ensuring it becomes the go-to resource for journalists to cite.
Suggested refresh timeframes:
-
Annual datasets (review each Q1)
-
Quarterly (start-of-quarter)
-
Monthly (first week)
-
Ad-hoc for major policy/news events
Being on the ball when it comes to news relating to your asset’s topic is key. Set up Google alerts for relevant key terms, such as interest rates, and use this opportunity to run reactive PR to your asset to inject even more links.
The importance of keeping content up-to-date
"Outdated content has long been something that SEOs take issue with, simply because it can suggest your website, more generally, is out of date and therefore not the most useful. This is even more important for AI visibility.
AI models are trained on a specific set of content and data, and after that, they’ll rely on their ability to search the web to inform their responses and, crucially, who they cite in those responses.
By keeping your content updated, you maximise your chances of being cited in an AI-generated response. You also send wider quality and freshness signals that will benefit both your AI and your SEO visibility."
OLIVER SISSONS
Hyper-relevancy examples in action
Example: "Small Business Website Statistics"
Top stats:

The content:

Coverage gained:

Example: "AI Statistics"
Top stats:

The content:

Coverage gained:

Key takeaways
-
Pick topics that sit in your product space and have clear demand for stats. If editors already cover it and your expertise fits, you’re in the right place.
-
Prove it with credible, current sources and show your working. Include a visible source under each data chart/visualisation, and provide a brief method at the end of the page.
-
Lead with the number, then the source and month, year. Use descriptive H3 questions and anchors so people can cite the exact line.
-
Make it easy to reuse. Clean alt text, labelled charts, sensible schema, fast load times.
-
Seed with a small launch, then refresh on a schedule. Log changes publicly so trust and links compound over time.
Ready to explore our hyper-relevancy link-building packages?
GET IN TOUCH