Long Term Shared Hosting Experiment
Introduction
For those creating their first website, knowing and deciding where to host it can be a huge stumbling block. Aggressive marketing from sub-standard hosting companies promises exceptional hosting solutions (offering speed, performance and consistent uptimes) at a surprisingly low price and those less tech and SEO savvy can be quick to sign up. Unfortunately, most business and new website owners never give the SEO implications of their hosting choice a single thought (or even know that they need to!).

Similarly, countless low-quality web design agencies will put profit over product and set clients up with lower-tier hosting sold through their own reseller accounts. They will do this without any consideration to the potentially harmful long-term SEO effects on their client’s website.
Bad Neighbourhood
In the context of where a website is hosted, a “bad neighbourhood” is commonly referred to as a host, IP address and/or other virtual location where a collection of low-quality, penalised and/or potentially problematic websites (e.g. porn, gambling, pharma) are hosted.
There has been much debate in the SEO community surrounding the subject of shared hosting services and if the “bad neighbourhood” type websites that they can attract can have a negative effect on the SEO results of other websites hosted alongside them. Whilst it is widely accepted that links from websites belonging to a bad neighbourhood can have a detrimental effect on the website being linked to, the same is not always said about simply being hosted on the same server and IP address as these bad neighbourhood type websites.
Concerned about the potentially harmful SEO effects that hosting a website on one of these shared hosting options could have on the websites of thousands of business owners, we decided to run a technical SEO experiment to find out what effect, if any, it had.
Note: Once you have finished reading this write up, check out our update to this experiment where we swapped the hosting of the domains round and measured how the rankings changed.
Hypothesis
We know that Google's algorithms are good at picking up on a variety of signals both on-page and off-page to determine how high-quality, trustworthy, authoritative and safe a website is for searchers (and the success of their business depends on effectively doing so). Google's AI algorithms are known to look for patterns which will allow them to identify lower-quality websites without the need for their engineers to manually review every website in the index. With some shared hosting solutions attracting lower-quality websites (like spam and PBN websites), we wondered if it is possible that Google's algorithms sees sharing an IP address with toxic and low-quality websites as part of a pattern of a lower-quality website.
We also know that when Google determines that a website is unsecure or putting users at risk, they will take steps to warn people of this. This is demonstrated clearly when you see a privacy warning before visiting a website when using Google Chrome.

It is also demonstrated when a “This site may be hacked” message is displayed under the search results of a domain that Google thinks might have been compromised.

Image taken from Google’s documentation here.
Even Google’s own documentation on manual actions highlights the risk that a low-quality and spammy hosting service can pose to the websites hosted on it. The documentation says that hosting a website where “a significant fraction of sites hosted on your free web hosting service are spammy” (they specify a free hosting service) can even lead to some or all of your website being removed from the search results.
Knowing how seriously Google takes the safety of their searchers and the lengths that they go to in order to ensure that the highest-quality websites rank strongly in the search results, we hypothesised that websites sharing a server, IP address and hosting resources with others known for being low-quality, spammy and toxic (belonging to a “bad neighbourhood”) wouldn’t rank as highly as those that didn’t.
Method
As with any experiment on such a volatile ecosystem, to test our hypothesis we knew that we would need to run a controlled experiment which reduced the impact of any outside ranking factors and variables to a minimum. We took several steps to remove the impact of such ranking factors starting by selecting a made up keyword with no historical user engagement data or ranking signals. More details in the Precautions section below.
Keyword
First, we came up with an entirely new keyword and checked that it did not have any results already showing in Google. We came up with the keyword ‘hegenestio’ and defined it as:
Hegenestio - The art and design behind server set up which results in fast, powerful and efficient websites.
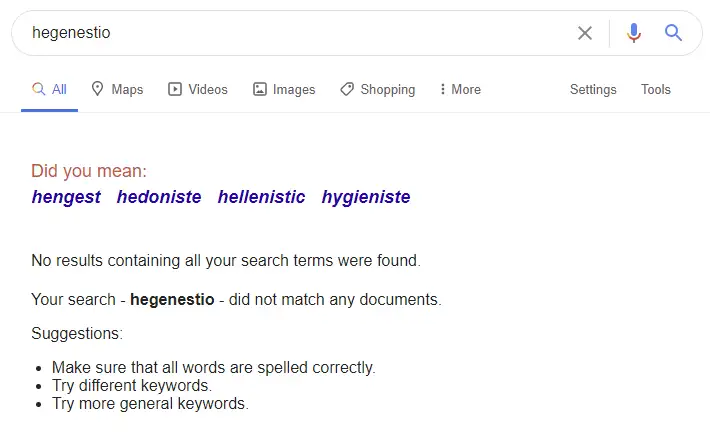
Searching the keyword before the experiment generated no results.
Domains
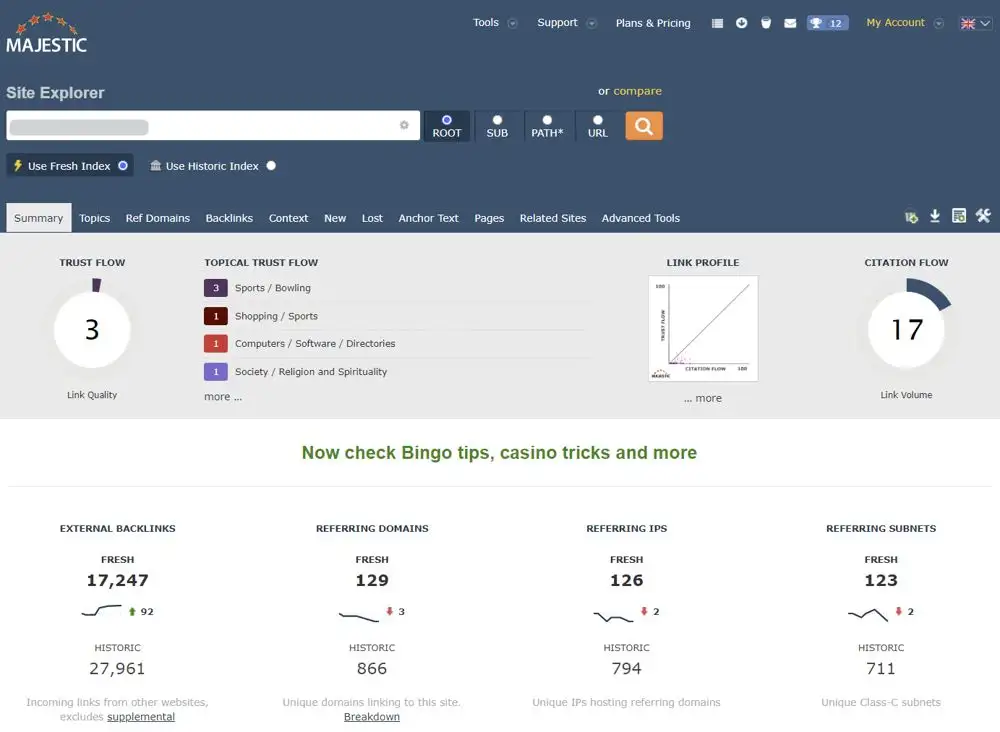
Next, we came up with 20 domain names and used search operators to ensure that they didn’t return any results when searched in Google. We used Majestic SEO and ahrefs to ensure that none of the domains had any links pointing to them and we also checked on archive.org to ensure that they didn’t host any websites previously.
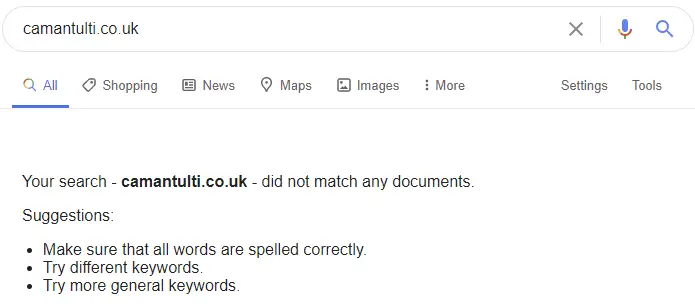
Searching any of the domains in Google before the experiment generated no results.
These steps were taken to ensure that all 20 websites started on a clean, equal slate. We didn’t want to risk any historical ranking signals influencing the results and skewing the experiment data.
Hosting
As where the website was hosted was the variable that we wanted to test in this experiment, 10 websites were hosted on dedicated IP addresses using Amazon Web Services (AWS) and 10 others were hosted on shared IP addresses that we knew also hosted bad neighbourhood type websites.

An example of a website hosted on one of the shared servers we used.
We carefully selected 10 shared hosts for this experiment by putting together an extensive list of shared hosting solutions. Next, we used Rapid7’s Project Sonar database to look at the associated IP address of each host. This FDNS data allowed us to scan over 230 million DNS ‘A’ records to identify the other websites hosted on each associated IP address.
Next, we filtered the results further by excluding any IP addresses that hosted under 200 other websites on them. With a list of hosts who had at least 200 other websites hosted on a single IP address, we analysed these ones further.
Finally, we made a shortlist using string matching techniques, based on keywords in the domain name of the other sites hosted on each IP address, to find those that might be associated with ‘bad neighbourhood’ type websites. These included domains with the keywords ‘sex’, ‘pharma’, ‘casino’, ‘poker’, ‘XXX’, ‘escort’, ‘cams’, ‘anal’, ‘blackjack’ and ‘slots’ in them.

Another example of a website hosted on one of the shared servers.
We then took a sample of domains from each IP address and ran them through ahrefs and Majestic SEO to make sure that at least some of them were using link building strategies that we think would violate Google’s guidelines.
Websites
Next, we created 20 websites and made sure that they were all just as optimised for the target keyword as each other, whilst minimising the influence of any other ranking factors.
Design
We used a similar static HTML design on each website to make sure that each one loaded quickly and had the same functionality.

Side-by-side images of 2 of the experiment websites.
Each design used slightly different CSS class and ID names so that the code was not identical. Styling and functionality was kept to a minimum to help ensure that the websites were all as fast as each other.
Page Speed & Performance
We set up a cron job to run hourly Page Speed Insight tests on every website everyday of the experiment to ensure that speed was not influencing the rankings.
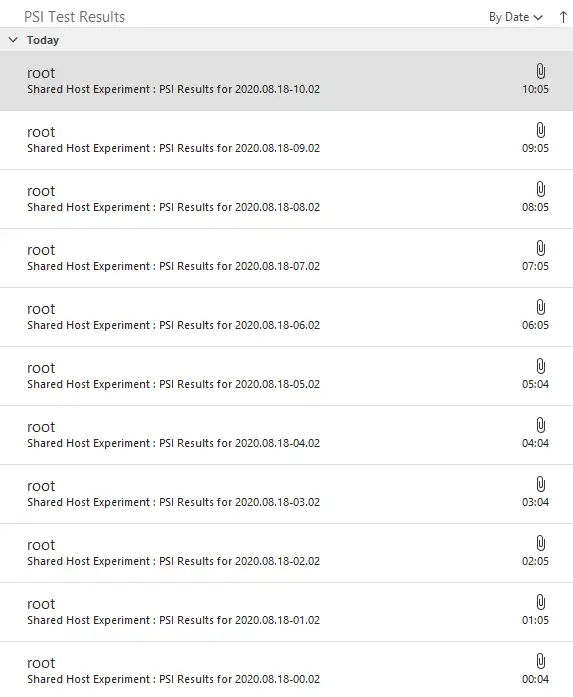
We scheduled hourly Page Speed Insight tests on all websites every day of the experiment. Results were saved locally and sent to us via email.
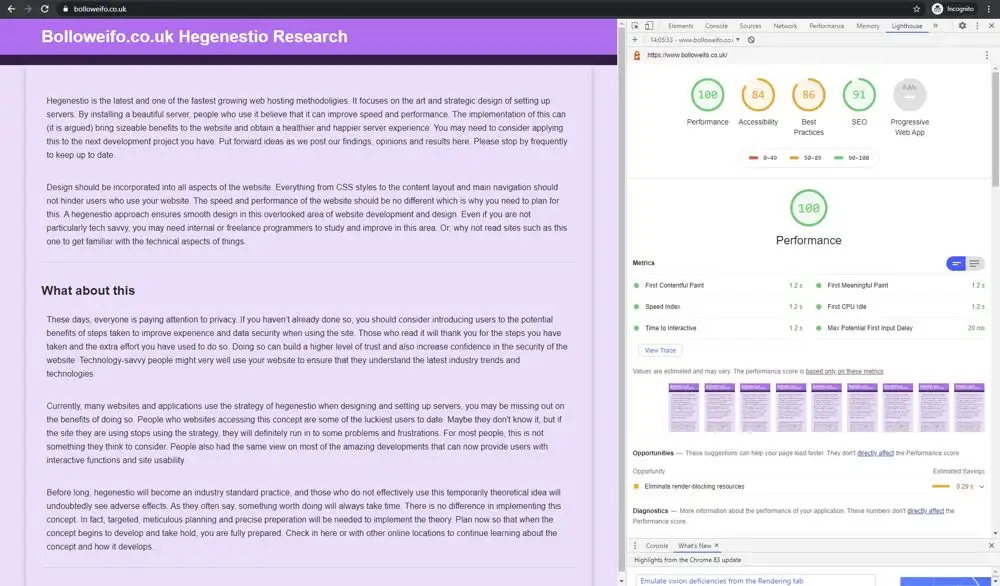
The speed and performance across all of the websites was, on average, identical (including accessibility and best practise scores seen in amber in the screenshot above).
We also set up StatusCake reports at the start of the experiment to check the uptime of the websites daily.

Screenshot from StatusCake of shared host websites uptime (100%) with the hosting providers hidden.

Screenshot from StatusCake of AWS websites uptime (100%).
These steps help demonstrate that the speed, reliability, consistency and uptime of the websites did not impact rankings.
Over the course of the experiment, the shared hosting websites had a 100% uptime and an average Page Speed Insights score of 100/100. The dedicated IP websites also had a 100% uptime and an average Page Speed Insights score of 100/100.
Content
We wrote similar content (although not identical) for each website where the target keyword was placed in the same position and used the same number of times on each website, to ensure that each site was just as optimised for the keyword.
Each website also had a basic, similar meta title and we did not assign a meta description.

The websites were all set to noindex when they were first published until we were ready to start the next stage of the experiment.
Indexing
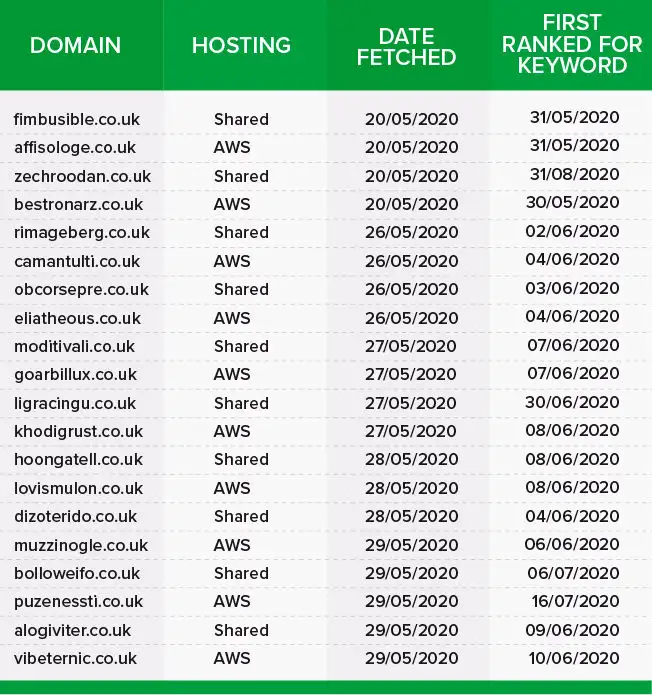 Once we had created all of the websites and minimised the risk of outside ranking factors influencing the search results, we then had to get all of the websites indexed.
We decided that we would create a Google Search Console account for each website (using a different IP address, name and sign up details each time, and creating each one at a different time/date) and fetch them to speed-up indexing. We would alternate between those websites hosted on a shared server and the AWS websites to ensure that the order in which the websites were first indexed did not influence the rankings.
Between the 20th of May 2020 and the 29th of May 2020, we fetched each website in Google Search Console starting with a website on a shared host.
Between the 30th of May and the 16th of July 2020, the websites gradually started ranking for the keyword. One website on a shared host (zechroodan.co.uk) didn’t rank for the keyword until the 31st of August 2020.
Precautions
Throughout the experiment, only those closely involved with the set up and monitoring of the websites knew any details about the target keyword and/or the experiment site domains.
Over the course of the experiment only myself, Shai Ahrony (our MD) and Simon Hubbard (our head of DevOps) knew what the target keyword was and any of the domain names. No one outside of our SEO company knew any details of the experiment.
We used Status Cake to monitor the uptime of the websites daily and set up a cron job to run page speed insight (PSI) tests on every experiment website every hour of every day of the experiment. All of the PSI test results (across mobile and desktop versions of each site) were used to work out the average speed of the shared hosting and dedicated IP address websites.
We set up an SEMrush position tracking campaign to track the rankings which also meant that at no point did we need to manually search the keyword.
![]()
On the 31st of July 2020, initial details were sent to Cyrus Shepard from Moz. Cyrus kindly agreed to act as an independent observer for the experiment so further details were shared with him including the target keyword, experiment domains and an SEMrush position tracking campaign. We requested that Cyrus didn't search the target keyword or visit any of the experiment websites until we were ready to conclude the experiment and publish the results.
On the 17th of August 2020 details were also shared with our in-house data analyst Niklas Jakobsen and our graphic designer Scott Bowman who assisted with the data visualisation of the results (again, both were also asked not to visit any of the experiment websites or search the target keyword).
Some precautions we took included:
- Not searching the target keyword or visiting the experiment sites over the course of the experiment (we set up an SEMrush position tracking campaign at the start to track rankings).
- Registering all domain names using different tags.
- Creating Google Search Console accounts from different IP addresses, at different dates and times and using different Gmail accounts and names to do so.
- Domains were fetched in Google Search Console gradually over 2 weeks at different times and dates and from different IP addresses.
- We alternated between shared hosting and AWS websites and started by fetching a shared hosting website first.
- Keyword was unknown to Google at the start of the experiment.
- Domain names were unknown to Google at the start of the experiment.
- No historical link data attached to any of the websites.
- Content on all of the websites was of the same length.
- Keyword density and positioning was kept the same across all of the experiment websites.
- Similar but not identical source code and styling.
- Multiple daily checks to ensure that page speed and uptime was equal across all of the experiment websites.
- No external visitors to the websites.
Results
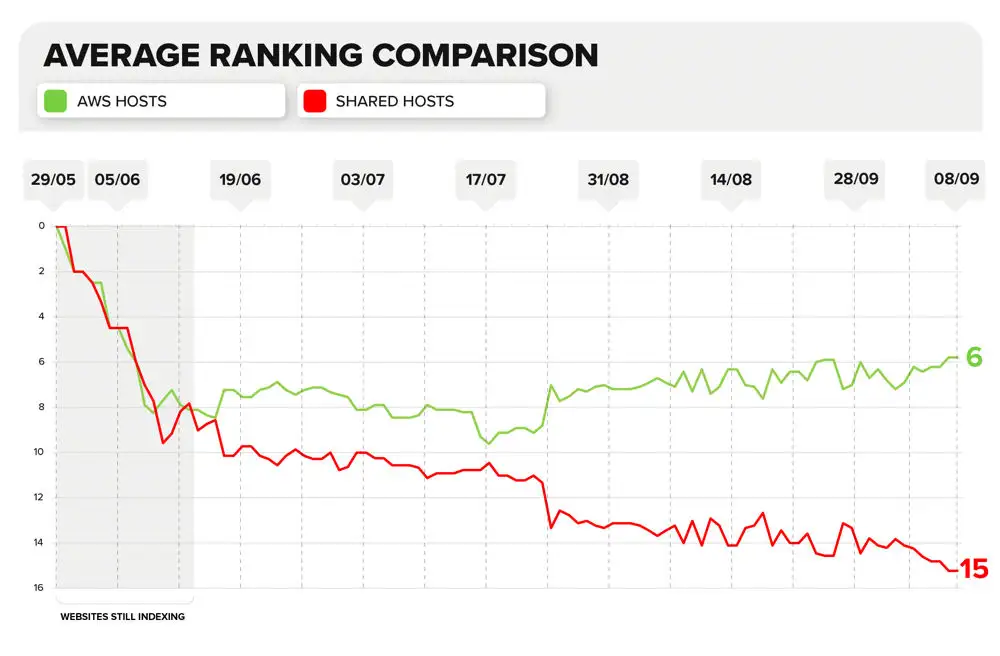
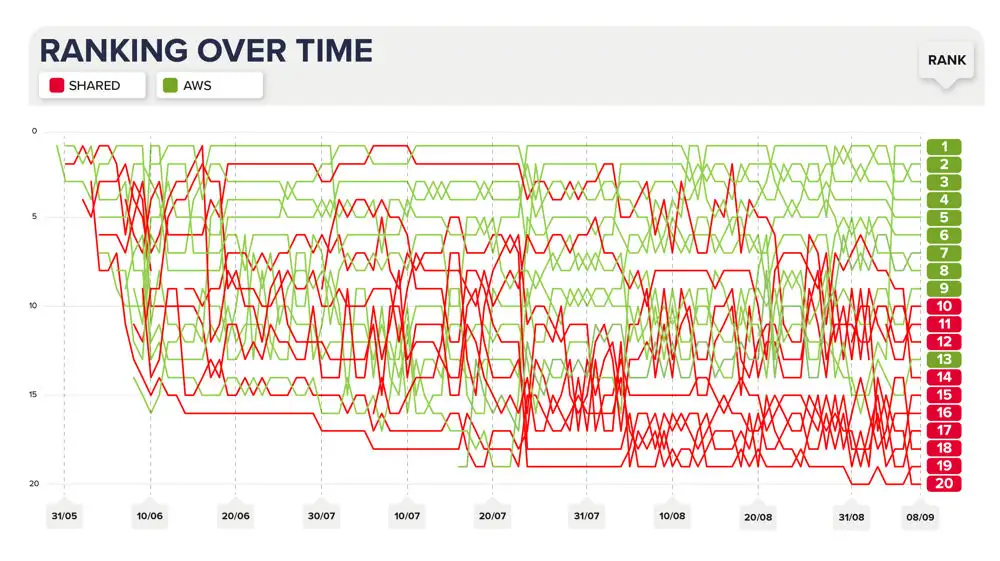
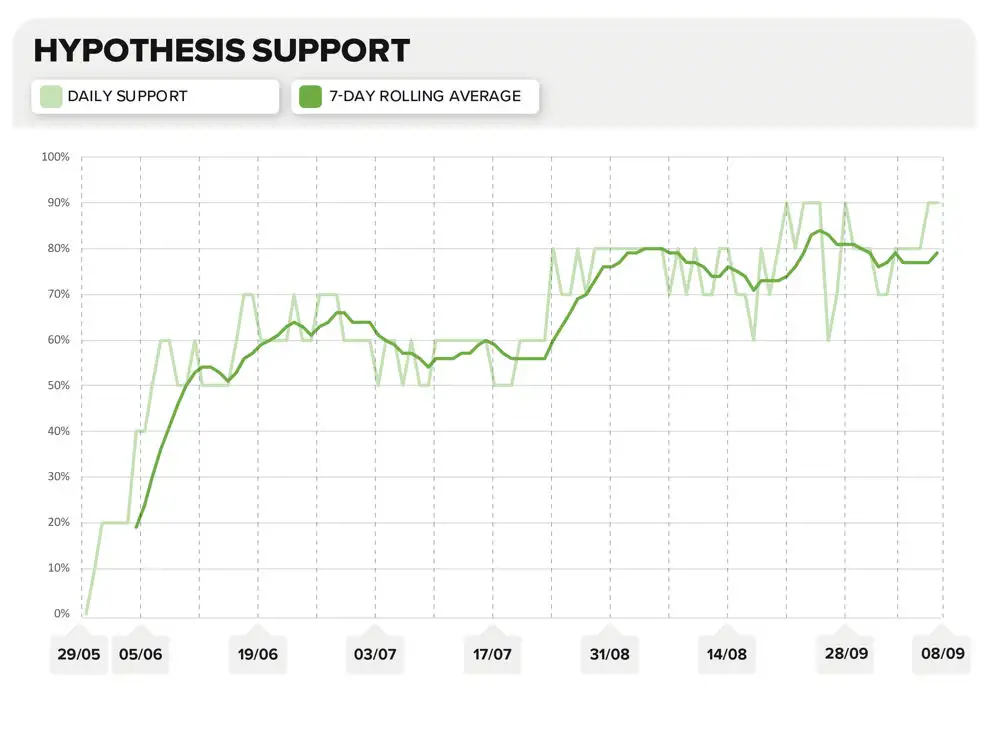
By the end of the experiment the results were conclusive: websites hosted on a shared IP address ranked less strongly than those hosted on a dedicated one.
Rankings Over Time Chart
See/download the image version of this chart in the appendices section below.
Hypothesis Support Chart
See/download the image version of this chart in the appendices section below.
Average Ranking Comparison Chart
See/download the image version of this chart in the appendices section below.
In the last couple of weeks, at least 80% of the first page results were consistently websites on a dedicated IP address.
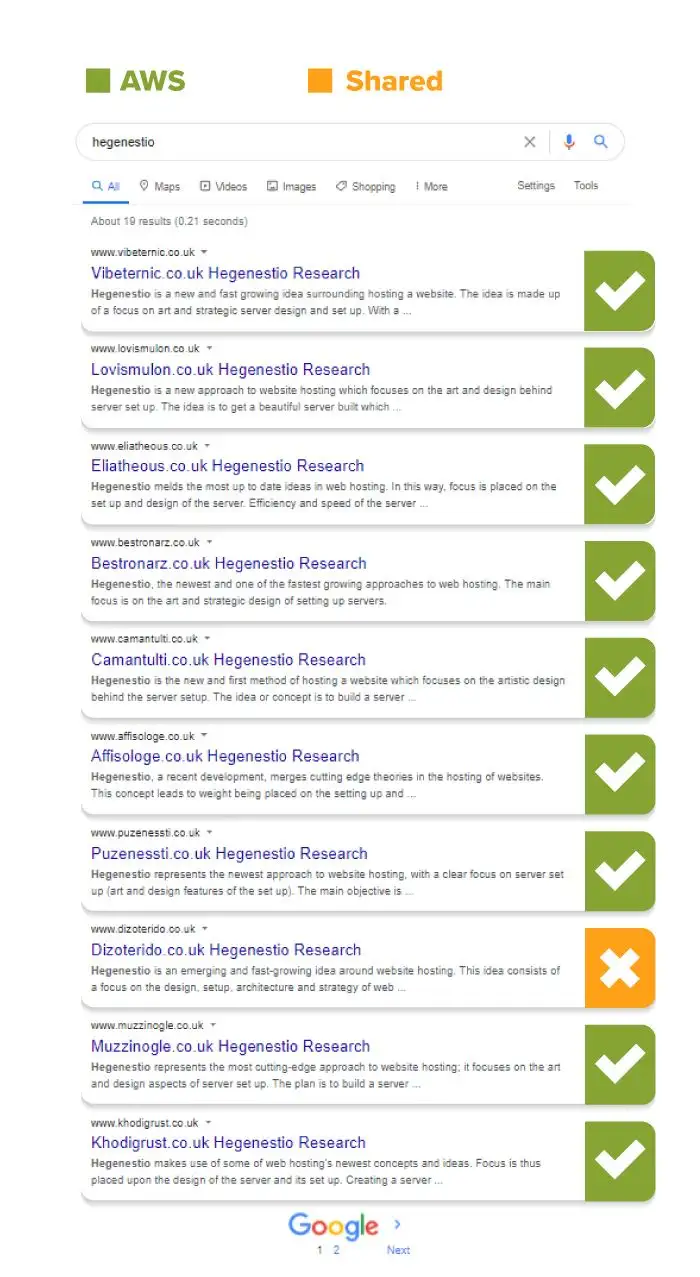
A search of the keyword on the 28th of August showed 9 AWS results on the first page.
Shady Ratio Test
We also attempted to measure if the total number of websites (and the number of bad neighbourhood websites) sharing an IP address affected rankings but no strong correlation could be found. To test this we assigned a 'shady ratio' to each shared hosting website which took into account the number of websites sharing the server and, of those sharing it, how many had any of the keywords used in the string matching process explained earlier in their domain. We then looked at how this correlated to the rankings of those websites but no clear pattern was observed.
We believe that this is due to the fact that without manually reviewing the thousands of websites hosted on each IP address, there is no way of knowing exactly how many websites on each could be considered bad neighbourhood type websites (not all of these would use our small sample of string matching keywords in their domain name).
Statistical Significance
After compiling the results we wanted to take things one step further and work out just how reliable they were. To do so, our in-house data analyst Nik Jakobsen carried out a One Sample T Test to work out the statistical significance of the results. Below he explains the process and his findings.
One Sample T Test
A t test can be used to determine whether the sample mean is statistically different from the hypothesised mean. The first step of the test involved coming up with a null hypothesis. This is a hypothesis that assumes that there is no significant difference between two specified variables. In this case, our null hypothesis is that the experiment website rankings are random. All the experiment websites will rank randomly between positions 1 and 20 regardless of the server and IP address that they are hosted on. Assuming this is true, the mean ranking for the dedicated IP address/AWS websites would be 10.5. This number is known as the population mean.
Null Hypothesis:
Next, we came up with the alternative hypothesis. In our experiment, this would be that the AWS experiment websites would rank higher/more strongly than the shared hosting ones. The alternative hypothesis is that the mean ranking for AWS/dedicated IP address websites is less than 10.5.
The alternative hypothesis is that the AWS websites performed better (ranked closer to the first search result) when compared to the websites hosted on a shared IP address. As such the alternative hypothesis is that the mean ranking for the AWS websites is less than 10.5.
Alternative Hypothesis:
Next, we worked out the sample mean for the AWS website rankings as an average over the last week of the experiment. The sample mean for the AWS websites was 6.56 (2 d.p.). We used these values and the t-test analysis tool in Excel to work out the results below.
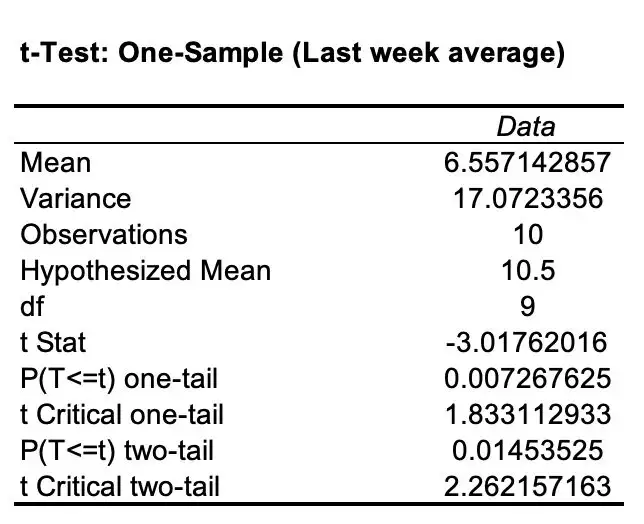
The t Stat in the chart above measures the size of the difference from H0 relative to the variance in the sample data. A t Stat of 0 for instance indicates that the sample results equal the null hypothesis exactly. A greater t Stat demonstrates more evidence to reject the null hypothesis (and further confirms the alternative hypothesis). The absolute value of the t-value is greater than the critical value of 1.833, so we can reject the null hypothesis.
Since p < 0.05, we can reject the null hypothesis that the sample mean is equal to the known population mean. In other words, we can conclude that the mean ranking for the AWS websites is significantly less than the average ranking for all the websites with a confidence interval of more than 95%.
With this test, we could calculate that there is only a 0.7% chance that the observed results were a coincidence. This is compared to a 99.3% chance that the observed results were, in fact, a result of our variable (the type of hosting the websites were set up on).
Conclusion
The results of this experiment suggests that shared hosting options that share IP addresses with toxic and low-quality websites can in fact have a detrimental effect on the organic performance and rankings of a website hosted there if the website ends up being hosted alongside lower-quality and potentially spammy ones (providing all websites being observed are otherwise on a level playing field).
Shared hosting solutions can attract those looking to publish lower-quality, spammy and toxic websites in a “churn and burn” fashion. Google and their AI approach to ranking the search results often relies on finding patterns that lower-quality websites or those looking to manipulate the search results share. By hosting your website alongside such domains, you risk positioning yourself in a bad neighbourhood that could be seen as part of a pattern that low-quality websites share.
It is important to note that these results don't show what effect the type of hosting you use when setting up a website would have in an actual SERP for a keyword with real competitors. In order to test a single variable (the hosting type), we had to minimise the effect of any outside ranking factors. This does however mean that we can not know how much weight is given to the type of hosting as a ranking factor (especially when other factors on-page and off-page are being taken into account alongside it).
Hosting your website on a dedicated server and IP address has many benefits and now, according to the experiment data, ranking higher in the SERPs could very well be one of them. If your budget allows for it, I would invest in a hosting solution that matches the quality of the products, services and information that you intend to offer on your website.
Remember to read the update to this experiment to see how rankings changed once we swapped the hosting round across all of the domains.
Thanks
Thanks to Cyrus Shepard at Moz for acting as an independent observer for this experiment and for looking over the results and SEMrush data. Also Britney Muller (formerly Moz) for looking at the initial data and Niklas Jakobsen, Scott Bowman, Simon Hubbard and Shai Aharony for helping put it together. Also to our whole SEO company and digital PR agency team for their support in reading, commenting on and sharing all of our experiments.
Appendices
Appendix 1: Rankings Over Time Chart
Appendix 2: Hypothesis Support Chart
Appendix 3: Average Ranking Comparison Chart
